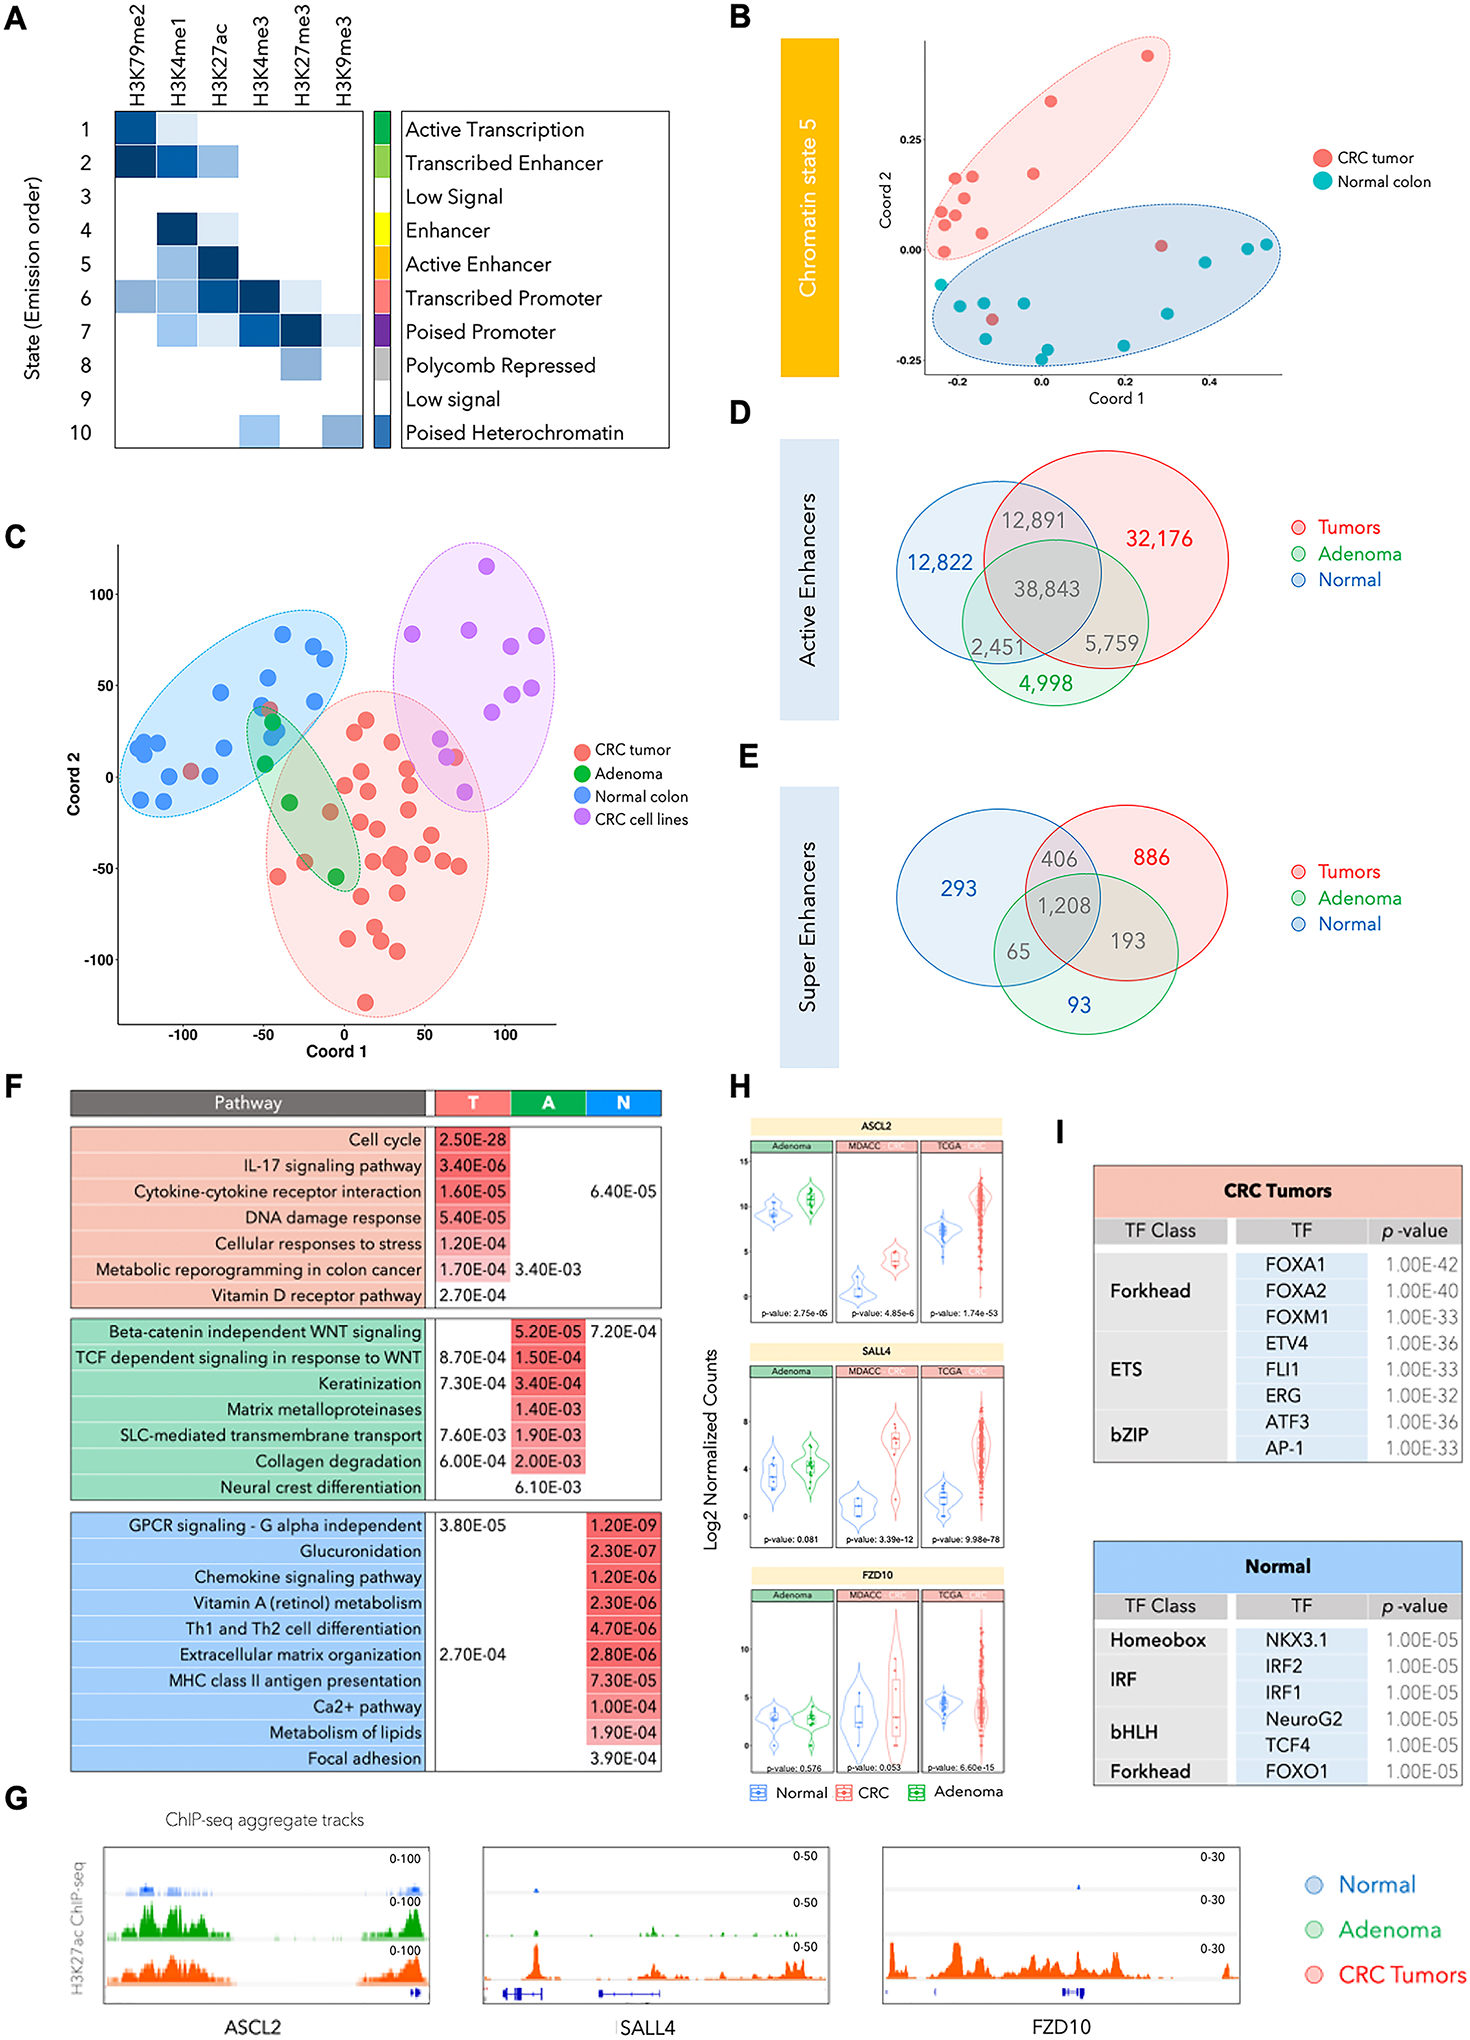
Fig. 1. H3K27ac-identified global enhancer pattern could differentiate colorectal cancer from normal colon.

A. Emission probabilities of ChromHMM-based 10-chromatin state calls, which is based on the global distribution of combinatorial patterns of 6 histone marks (H3K4me1, H3K27ac, H3K4me3, H3K27me3, H3K79me2, and H3K9me3) from 13 adenocarcinomas and 12 adjacent normal tissues. Each row is representative of a combinatorial chromatin state pattern, which is annotated on the right based on the constituent histone mark and neighborhood plot (Supplementary Fig. S1B). Columns represent each histone mark. Colors represent the frequency of occurrence of that mark in the corresponding chromatin state on a scale of 0 (white) to 1 (blue).
B. Multidimensional scaling (MDS) plot for chromatin state 5 between normal tissues (blue) and adenocarcinoma samples (red).
C. MDS plot for global H3K27ac patterns in the adenomas (A), adenocarcinomas (T), adjacent normal colon (N) and cancer cell lines. Adenoma samples are spread over normal and tumor samples and cannot be distinguished with use of H3K27ac. Red, Green, Blue and Purple colors were used for Tumor, Adenoma, Normal Colon and CRC cell lines respectively.
D. Venn diagram showing overlaps between total number of H3K27ac-defined active enhancer peaks in normal samples (blue), adenomas (green) and CRC tumors (red).
E. Venn diagram showing overlaps between total number of super-enhancer peaks (called using ROSE) in normal samples (blue), adenomas (green) and CRC tumors (red).
F. List of significantly enriched pathways in genes targeted by enhancers specific to CRC tumors (T), adenomas (A), and normal colon tissue (N). q-values are shown and are color-coded based on the level of significance.
G. Integrative Genomics Viewer (IGV) images showing enrichment of H3K27ac peaks around ASCL2, SALL4 and FZD10 genes using aggregate ChIP-seq profiles of normal colon, adenoma and CRC tumors.
H. Violin plots showing mRNA expression levels for ASCL2, SALL4 and FZD10 in adenomas, the adenocarcinoma cohort used in this study (labeled as MDACC) and TCGA adenocarcinoma cohort. The reported p-values were calculated using the DESeq252.
I. List of enriched transcription factor (TF) motifs in CRC- or normal tissue-specific active enhancers. Motifs are identified using HOMER27 on the basis of the shared H3K27ac peak in each group.
