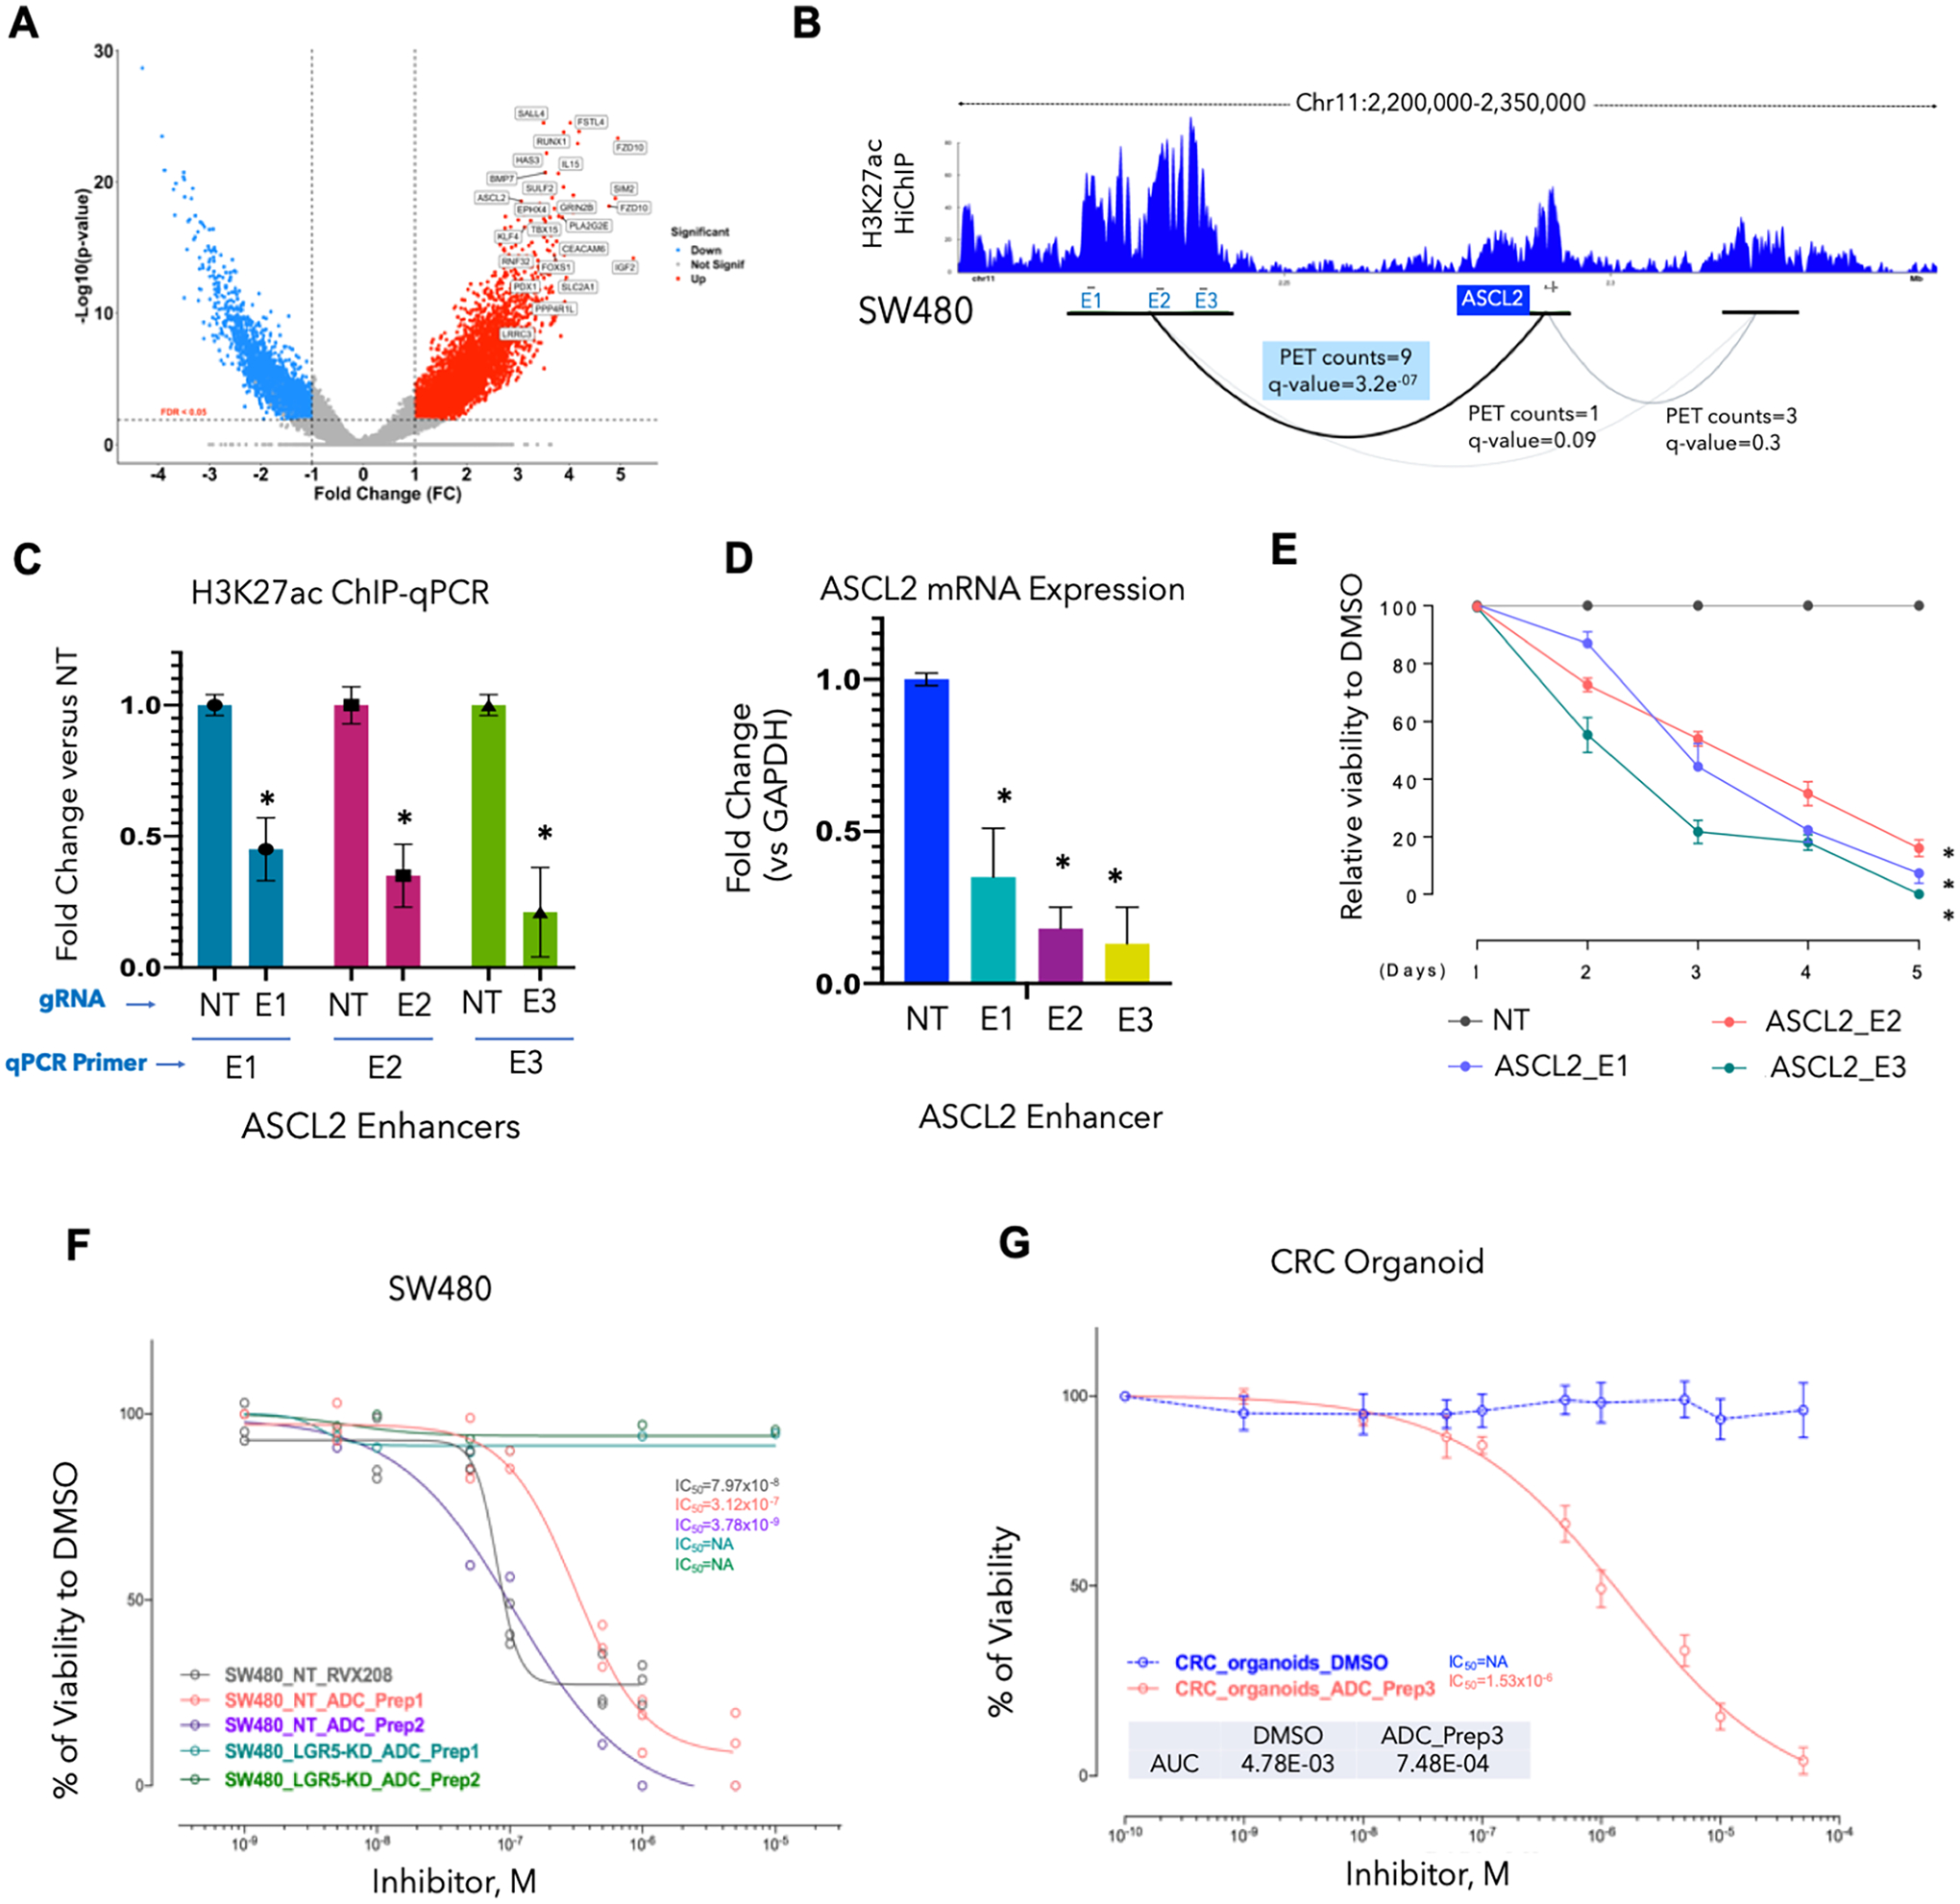
Fig. 2. Inactivation of top tumor-specific enhancers leads to transcriptional downregulation and loss of cell proliferation.

A. Volcano plot showing top CRC-enriched typical enhancers ranked based on fold-change and p-value. Top de novo gained enhancers among tumor (n = 33) as compared to adjacent normal (n = 15) samples are annotated according to their associated genes. Thresholds of log2FC > 1 and FDR < 0.05 are used to annotate de novo enhancer peaks. ASCL2 and FZD10 enhancers are among this subset of highly enriched regions. There are two top ranked enhancer peaks around FZD10 gene.
B. Interaction map of active enhancers (E) with the gene promoter (P) around the ASCL2 locus as determined in SW480 cell line by HiChIP. Interactions were observed in a super-enhancer (E1–E3) region located ~70kb upstream of ASCL2 promoter (PET counts=9, q-value=3.2e−07). These regions are among the highly enriched tumor-specific enhancers and were present in multiple CRC cell lines (Supplementary Fig. S4A).
C. Bar graph showing relative enrichment of H3K27ac as derived from a ChIP-qPCR experiment on E1–E3 for ASCL2 super-enhancer (from panel B) in SW480 cells harboring specific or non-targeting (NT) gRNAs to these enhancers. Y-axis represents fold change in intensity of H3K27ac signal for each enhancer in gRNA harboring cell in comparison to the cells harboring NT gRNA. Asterisk * denotes p-value < 0.05.
D. Bar graph showing relative ASCL2 mRNA expression in E1–E3 gRNAs for ASCL2 super-enhancer harboring SW480 cells in comparison to parental cells (ASCL2_NT).
E. Growth curve showing relative viability of SW480 cells harboring E1–E3 for ASCL2 super-enhancer in comparison to parental cell (ASCL2_NT) showing lower rates of proliferation in cells with ASCL2-inactivated enhancers.
F. Growth curves for LGR5-silenced SW480 cells (SW480LGR5-KD) in comparison to the parental cells upon treatment with increasing concentrations of two preparations of antibody-drug conjugate (ADC) with bromodomain inhibitor (RVX208) conjugated to LGR5 antibody (ADC-Prep1 and ADC-Prep2) and RVX-208 alone. Y-axis shows percent viability of treated cells in comparison to control (DMSO) treated cells.
G. Growth curves for a patient-derived CRC organoid upon treatment with LGR5-RVX208 conjugate (ADC). Y-axis shows percent viability of treated cells in comparison to control (DMSO) treated cells.
