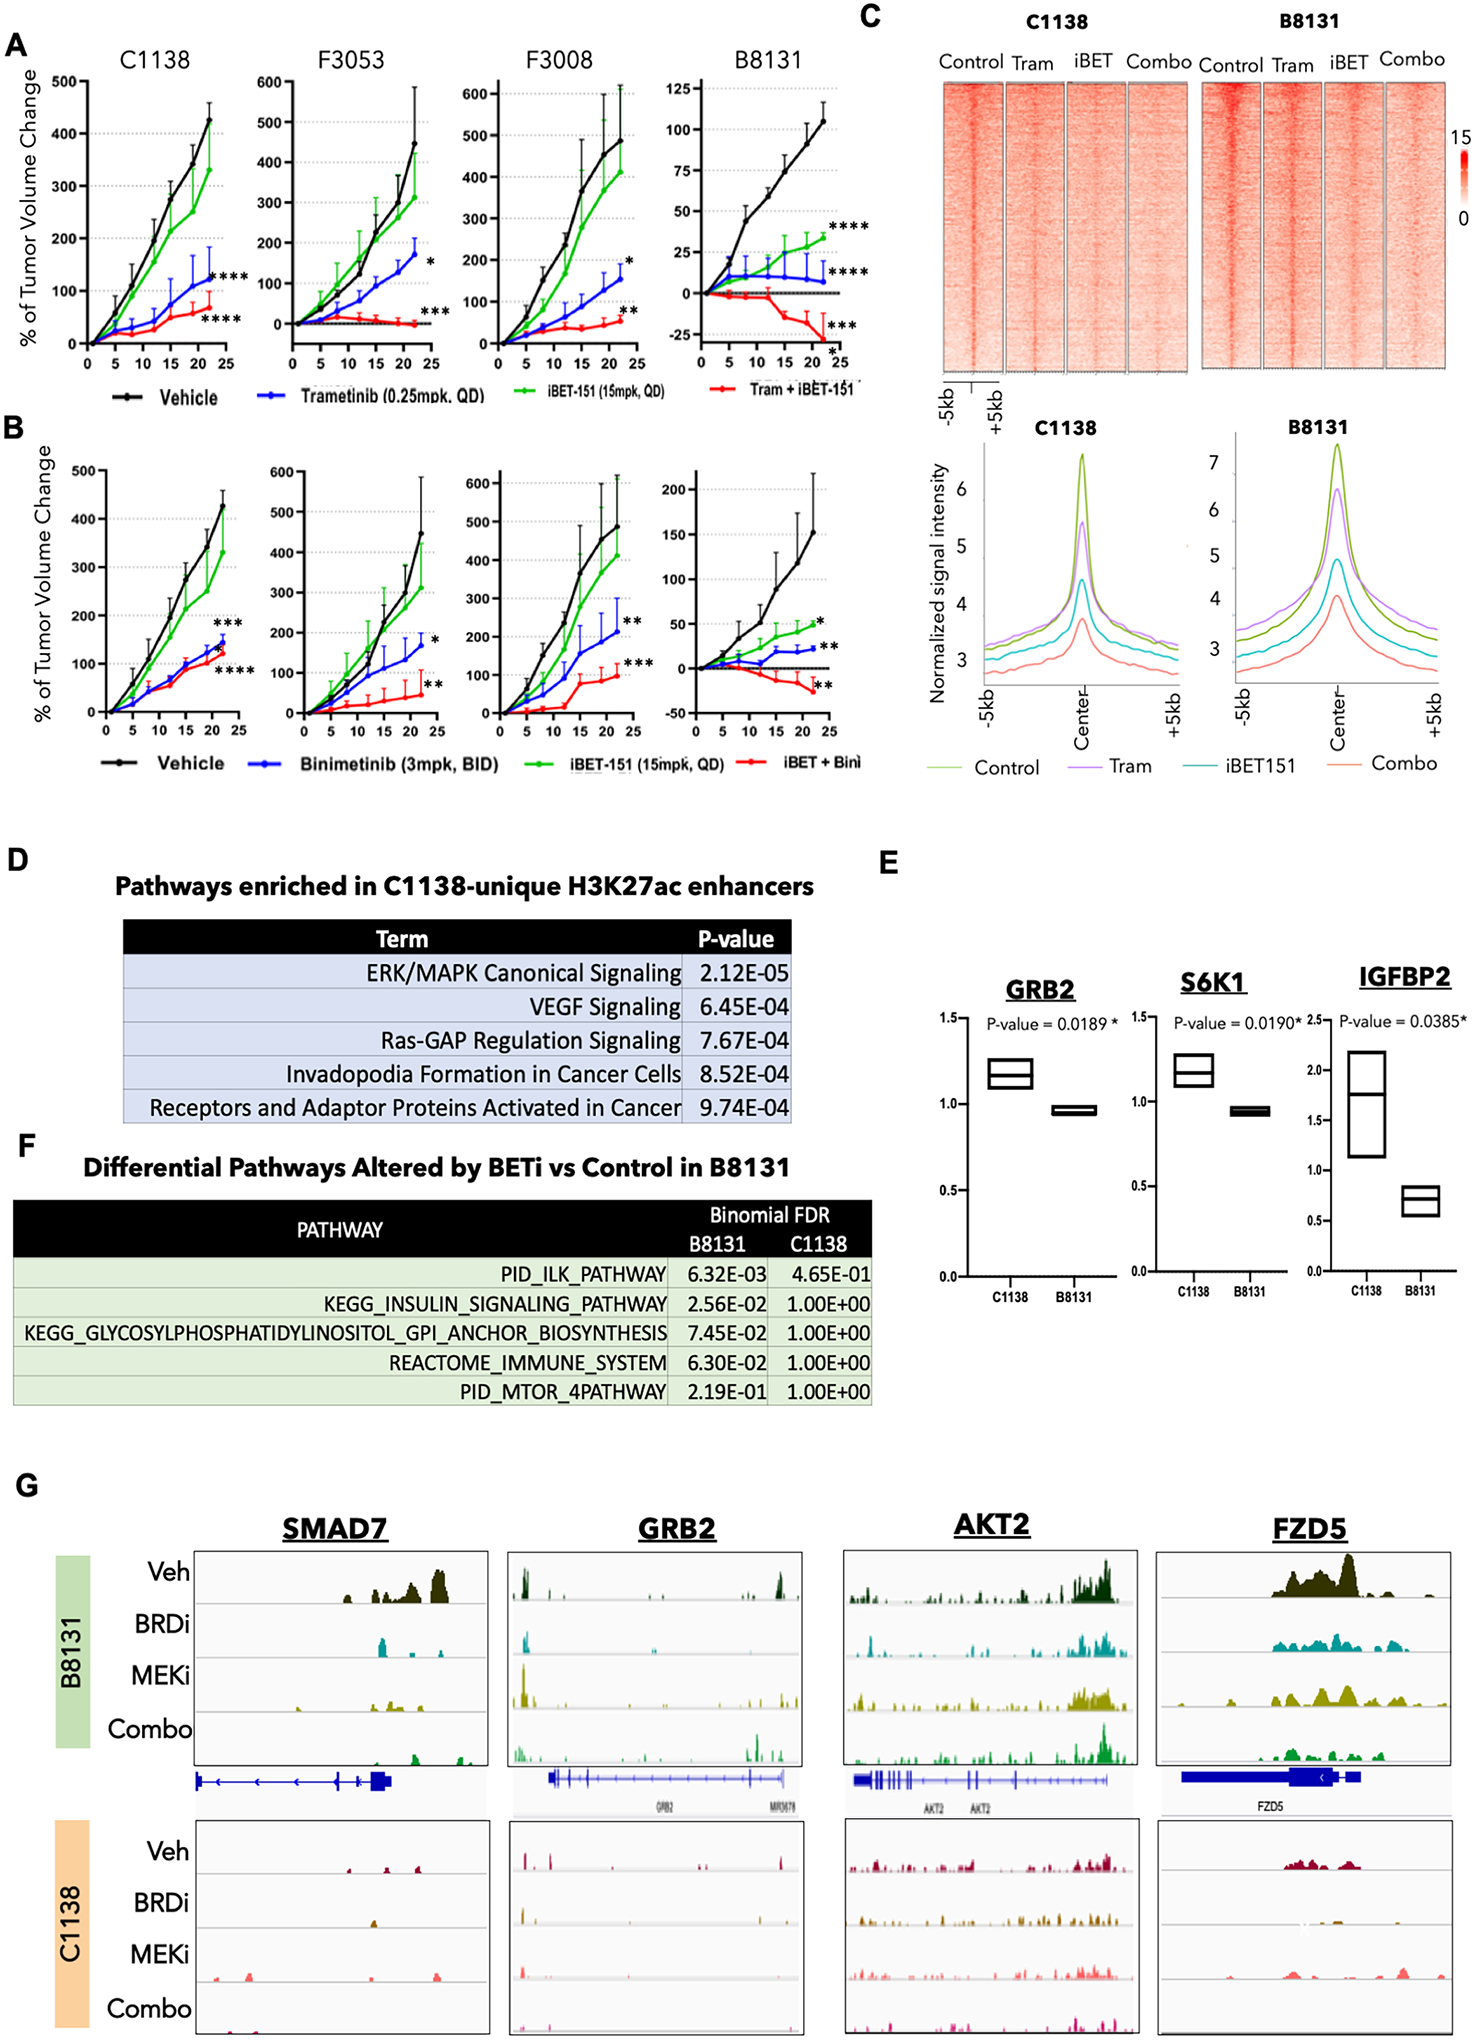
Fig. 3. BRDi plus MEKi shows differential responses in different PDX models.

A. Tumor volume curves for C1138, F3053, F3008, and B8131 on treatment with MEK inhibitors (trametinib), BRD inhibitor (i-BET151), and a combination of MEK and BRD inhibitors (trametinib + i-BET151) along with the control vehicle group (n = 3–5 for each arm). P-values represent pairwise t test comparison between the experimental arm to vehicle treatment. *= p < 0.05; ** = p < 0.01; *** = p < 0.001; **** = p < 0.0001. Please refer to Supplementary Fig. S6B for all pair-wise comparisons of the p-values.
B. Tumor volume curves for C1138, F3053, F3008, and B8131 on treatment with MEK inhibitor (binimetinib), BRD inhibitor (i-BET151), and a combination of MEK and BRD inhibitors (binimetinib + iBET151) along with the control vehicle group (n = 3–5 for each arm). P-values represent pairwise t test comparison between the experimental arm to vehicle treatment. * = p < 0.05; ** = p < 0.01; *** = p < 0.001; **** = p < 0.0001. Please refer to Supplementary Fig. S6B for all pair-wise comparisons of the p-values.
C. Heatmap (top panel) and average intensity plot (bottom panel) for H3K27ac peaks in vehicle, trametinib, iBET-151 and combination (iBET-151 plus trametinib) treated PDXs, B8131 (responder) and C1138 (non-responder).
D. Elsevier pathways (identified by Enricher) enriched in gene targets of H3K27ac peaks unique to C1138 versus B8131 PDXs.
E. Box plots showing protein expression (RPPA) of GRB2, S6K1 and IGFBP2 enriched in C1138 versus B8131 PDXs.
F. Differential pathways between those enriched in gene targets of lost H3K27ac-peaks in iBET-151 versus control treated B8131 and C1138.
G. IGV snapshots of H3K27ac peaks around SMAD7, GRB2, AKT2 and FZD5 in vehicle, trametinib, iBET-151 and combination (iBET-151 plus trametinib) treated B8131 and C1138.
