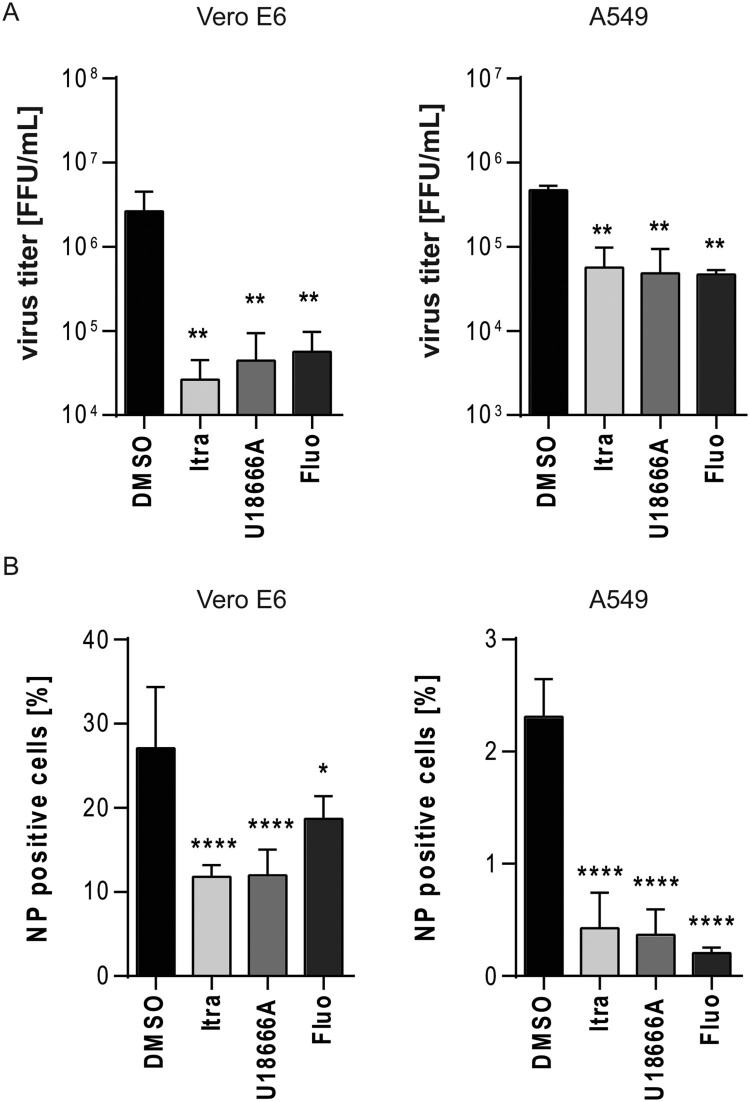
Figure 5.
Evaluation of the antiviral potential at higher initial infectious dose. Vero E6 and A549 cells were infected with EBOV (Zaire, MOI 10) for 24 h and treated with itraconazole (Itra, 2 µg/mL), U18666A (2 µg/mL), or fluoxetine (Fluo, 5 µM) for the entire infection period. DMSO served as solvent control. (A) Viral titres were determined by TCID50 assay and FFU were calculated. (B) Quantification of viral infection levels via immunofluorescence assay. Numbers of NP positive cells were expressed as percentages of total cell counts. Bars show the means ± SEM of five independent experiments. Data were analyzed for statistically significant differences with one-way ANOVA followed by Dunnett’s multiple comparison test; p-values ≤ 0.05 were considered statistically significant. *p ≤ 0.05, **p ≤ 0.01, ****p ≤ 0.0001.

