
Figure 1.
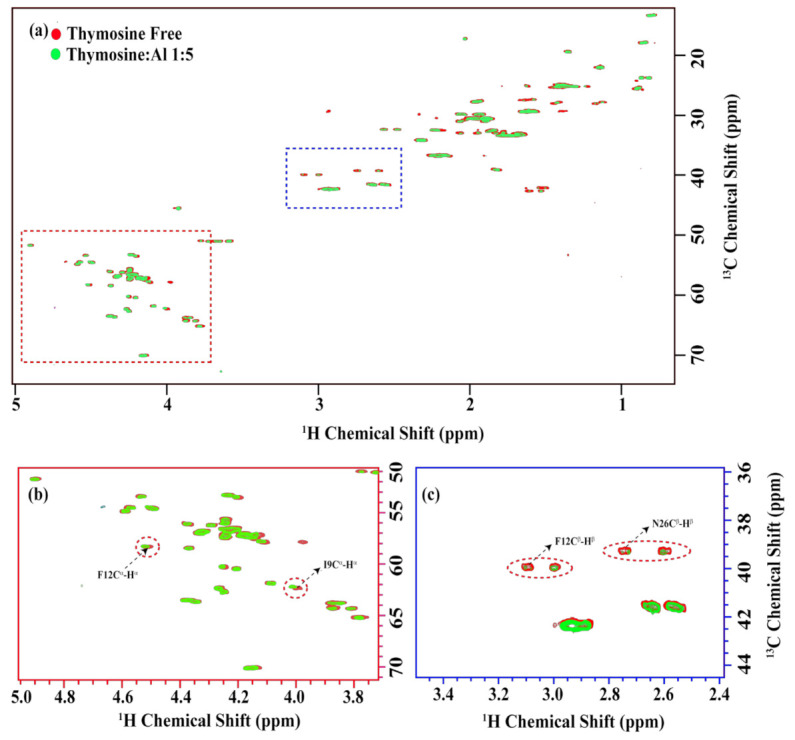
(a) The overlay of the two-dimensional 13C-1H HSQC spectra in free form (red) and with thymosin: Al3+ ratio 1:5 (green). The alpha and beta proton regions are highlighted in the red and blue dotted rectangles in (a) and are presented in (b,c), respectively. Noticeable chemical shift changes were observed for F12, I9 as indicated by red circles in (b). Otherwise, the chemical shifts remain the same, with only some decrease in the intensities, as highlighted by the red circles in (c).