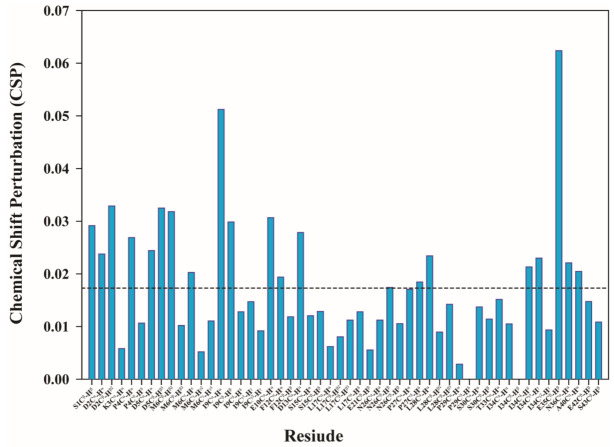
Figure 2.
The chemical shift perturbation (CSP) plot for the 48 distinct peaks from the overlay of the two-dimensional 13C-1H HSQC spectra in free form and with thymosin:Al3+ ratio 1:5.The formula used for CSP is Sqrt [1/2(δH2 + α ∗ δ13C2)] as suggested by Willamson [26]. The α was kept 0.3.

