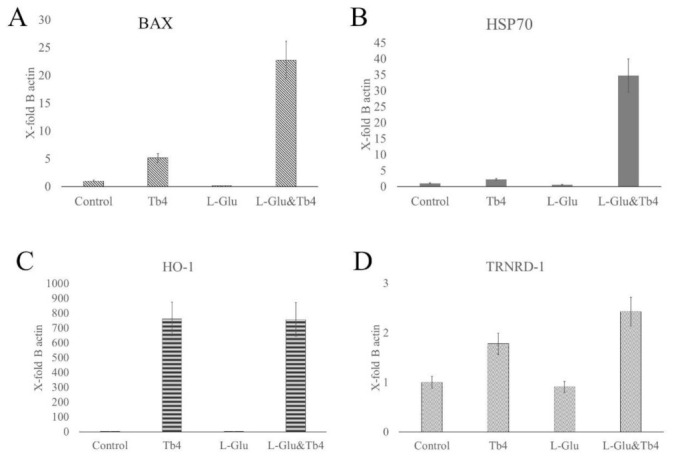
Figure 6.

mRNA expression levels (mean and standard error) of (A) BAX, (B) HSP70 (C) HO-1, and (D) TRNRD-1, which are related to stress conditions, in J774 cells. The amount of mRNA of each gene for each experiment was normalized with the respective value of the beta-actin housekeeping gene mRNA (X-fold of beta-actin expression). Statistical comparison of the gene’s expression in different experimental conditions was performed with 5.0 GraphPad Prism software. The data were also analyzed with one-way ANOVA. p values < 0.05 was considered significant.
