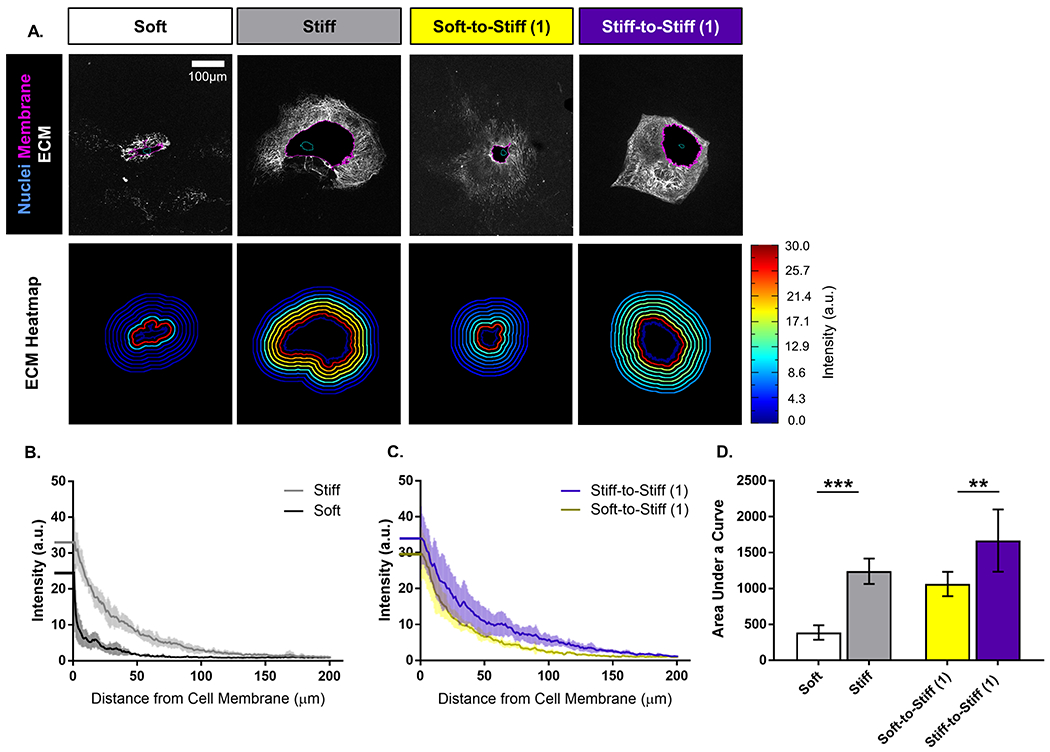
Figure 2.

(A) Representative images of rat adipose-derived stem cells (ASCs) immunolabeled for (top row) nuclei (blue outline), cell membrane (magenta outline), and extracellular matrix (white), and (bottom row) intensity heatmap of extracellular matrix deposition. (scale bar = 100 μm). Quantitative measures computed from fluorescent images for extracellular matrix intensity profile for (B) Soft and Stiff groups, and (C) Soft-to-Stiff (1) and Stiff-to-Stiff (1) groups. (dark line = mean, and light lines = standard deviation). (D) Area under the curve for the extracellular matrix intensity profiles for each group. Data are shown as mean ± standard deviation. ** p < 0.01. *** p < 0.001.
