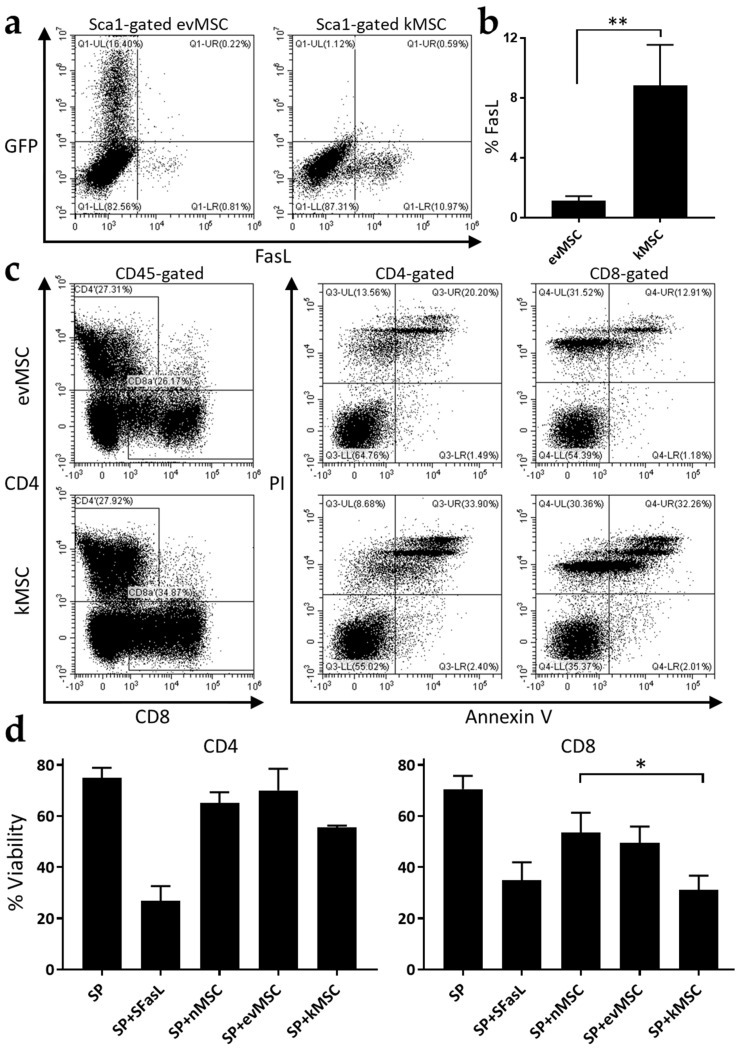
Figure 2.
MSC overexpressing FasL induce the death of CD4+ and CD8+ T cells. (a) Representative flow cytometric dot-plots depicting GFP and FasL expression in MSC following transduction with Ad-GFP (left) and Ad-FasL-GFP (right). (b) Quantification of flow cytometric analysis of FasL expression on MSC transduced with the two adenoviruses. (c) Representative apoptosis analysis of activated splenocytes following co-culture with empty vector and FasL adenovirus-transduced MSC. In the dot-plots on the left are presented the gates for CD4+ and CD8+ cells (from the CD45+ population) while on the right are the dot-plots of PI- and Annexin-V-labelled CD4+ and CD8+ populations. (d) Graphical representation of the percentage of viable CD4+ and CD8+ cells after 72 h co-incubation with SuperFasL (SFasL), naïve MSC (nMSC), empty vector (evMSC), and FasL adenovirus-transduced MSC (kMSC). Data are means ± SD (n = 3), * p < 0.05, and ** p < 0.01.

