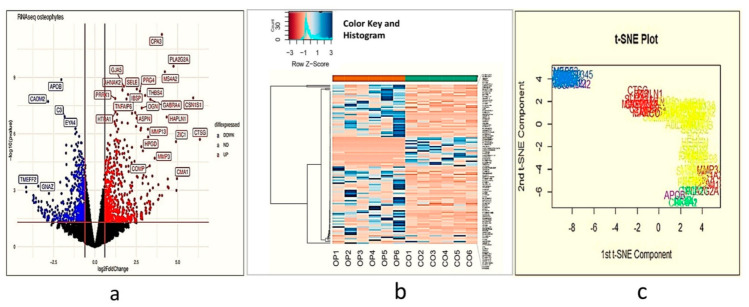
Figure 1.
Demonstrate an overview of differentially expressed genes in transcriptome analysis performed using osteophyte samples and non-osteophytic control tissue obtained from six knee OA patients (n = 595). (a) Volcano plot of the differentially expressed genes. Here, black dots represent insignificant genes, while blue and red dots represent down-regulated and up-regulated genes, respectively. The plot is generated using LogFC values of the expressed genes. Carboxypeptidase A3 (CPA3), selectin E (SELE), membrane-spanning 4-domains A2/Fc fragment of IgE receptor 1a (MS4A2/FCERI), chymase 1 (CMA1), interleukin 1 receptor-like 1 (IL1RL1), collagen type 1 alpha 1 chain (COL1A1), COL1A2, matrix metalloproteinase 1 (MMP-1), MMP-3 and MMP-13 are among the significantly upregulated genes; (b) Histogram of the highly significant genes, which were obtained after K-means cluster analysis; (c) t-SNE plot of ‘highly differentiated’ genes (generated after K-means cluster analysis). t-SNE is a dimensional reduction technique of presenting large gene data sets; we generated a two-dimensional t-SNE plot to verify the cluster analysis. For this, we considered logFC, logCPR and p-values of the highly significant genes in the osteophyte specimens.

