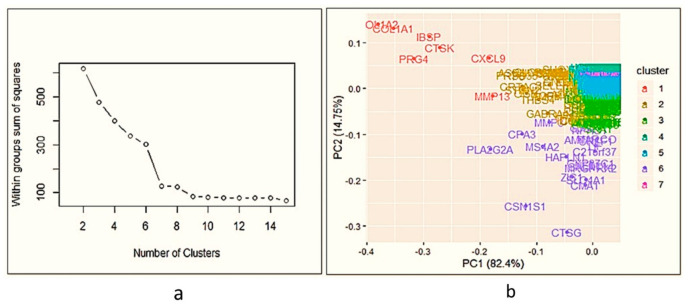
Figure 2.
Cluster analysis of differential gene expression between osteophyte and control samples. (a) Denotes elbow method of k-means clustering to find out highly significant up-regulated; the optimum number of clusters is 7. (b) Cluster analysis of up-regulated genes—as k-means clustering for up-regulated is 7, the data is divided into 7 clusters. For up-regulated genes, clusters 1, 5 and 7 showed p < 0.001; 87 genes are highly up-regulated in osteophytes.

