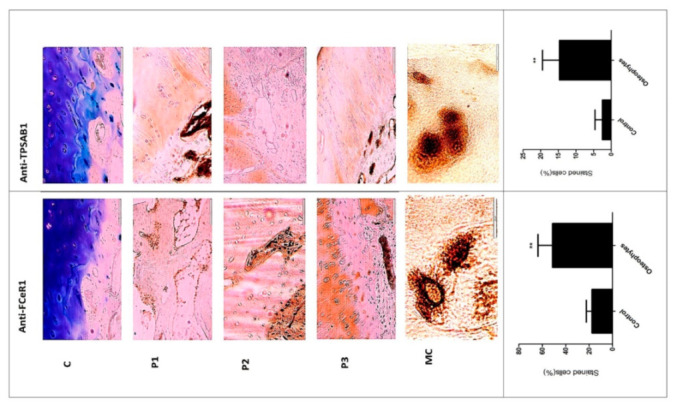
Figure 4.

Representative slides of IHC staining with anti-FCERI and anti-TPSAB1 to visualize mast cells in osteophyte sections. Representative areas of osteophytes of study patients are shown as P1, P2 and P3. Antibody-stained mast cells were localized in bone trabeculae, cartilage region, where the columnar chondrocytes can be seen. MC are mast cells at 100X magnification revealing granular features. Bottom panel: histograms—control and osteophytes, denote anti-FCERI and anti-TPSAB1 stained cells (%) respectively; * p < 0.05, ** p < 0.01 compared to control.
