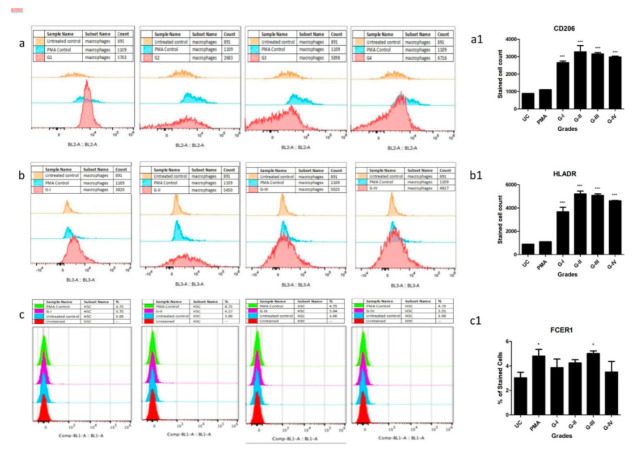
Figure 5.
In vitro cell differentiation assay, where ThP1 and HSCs were treated with 10% (of culture medium) SF of KL grade I to IV for 9 days; expression of cell surface markers were analysed by flow cytometry on the 10th day. Shown are the representative overlaid histograms of the surface markers on ThP1 and HSCs. Bar graphs are the summary of the surface markers’ expression study, performed in triplicate. Sequence of ThP1 to macrophages differentiation analysed by (a) CD206, and (b) HLA-DR, (a1,b1) represent summary of CD206+ and HLADR+ expression values on ThP1 to macrophages differentiation sequence respectively; (c) sequence of HSCs to mast cells differentiation analysed by FCERI, (c1) represent summary of FCERI+ expression values on HSCs to mast cell differentiation sequence; * p < 0.05, *** p < 0.001 compared to UC.

