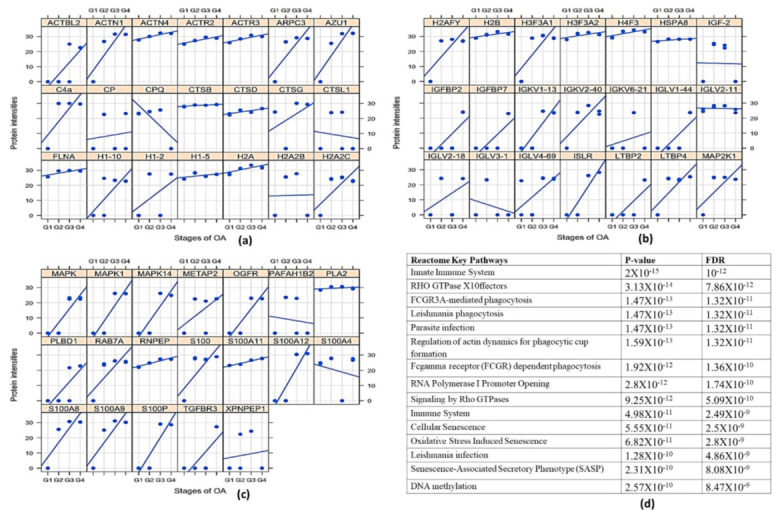
Figure 6.

Proteomics analysis of OA SF. For the proteomics analysis, four patients of each grade (4 × 4 = 16) were analysed through MS/MS. (a–c) represents a grade-wise picture (lattice plots) of different protein subsets that were differentially expressed in OA SFs; differential protein expressions were determined by comparing the fold change of each protein found in KL grade I SFs. In total, 799 proteins were found differentially expressed. These proteins contain mast cell regulatory factors such as light chain immunoglobulins, S100 A12, histones, actins, mitogen-activated protein kinase (MAPK) family and mast cells degranulation proteases such as carboxypeptidase and cathepsins. (d)—functional analysis of the proteomics study in the form of key Reactome pathways with their p-values and FDRs.
