
Figure 1.
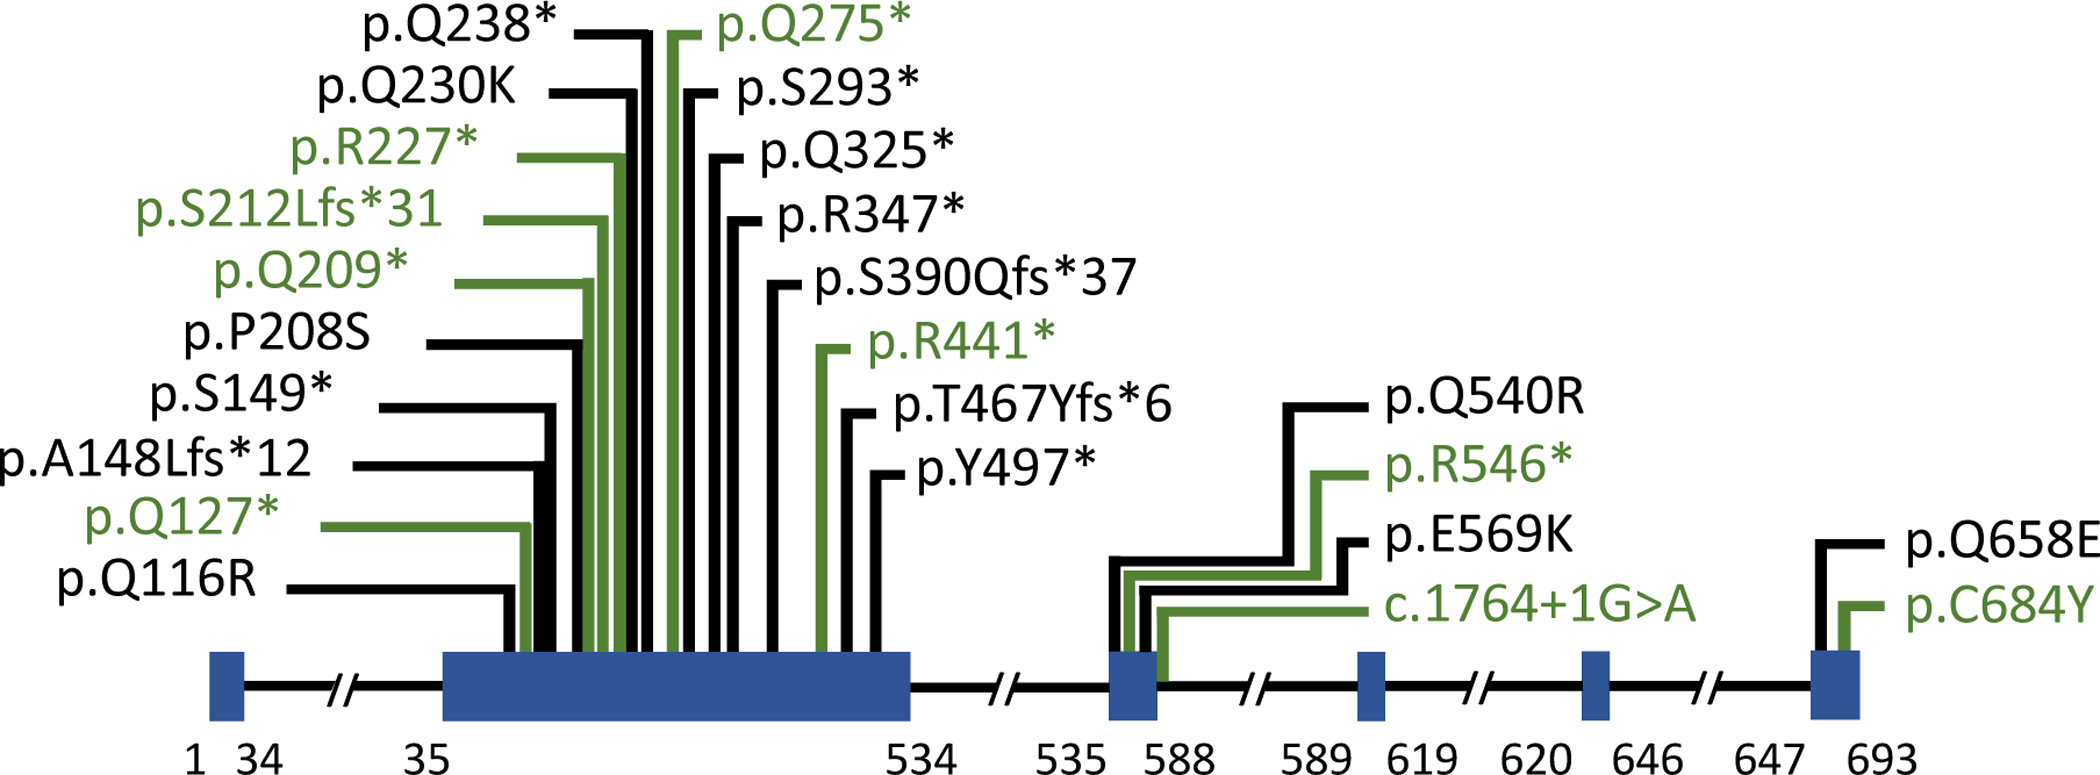
TAB2 gene schematic. Pathogenic variants in TAB2 that were previously reported are shown in black and pathogenic variants newly reported are shown in green. Exons are illustrated as blue boxes.
Official websites use .gov
A
.gov website belongs to an official
government organization in the United States.
Secure .gov websites use HTTPS
A lock (
) or https:// means you've safely
connected to the .gov website. Share sensitive
information only on official, secure websites.
TAB2 gene schematic. Pathogenic variants in TAB2 that were previously reported are shown in black and pathogenic variants newly reported are shown in green. Exons are illustrated as blue boxes.