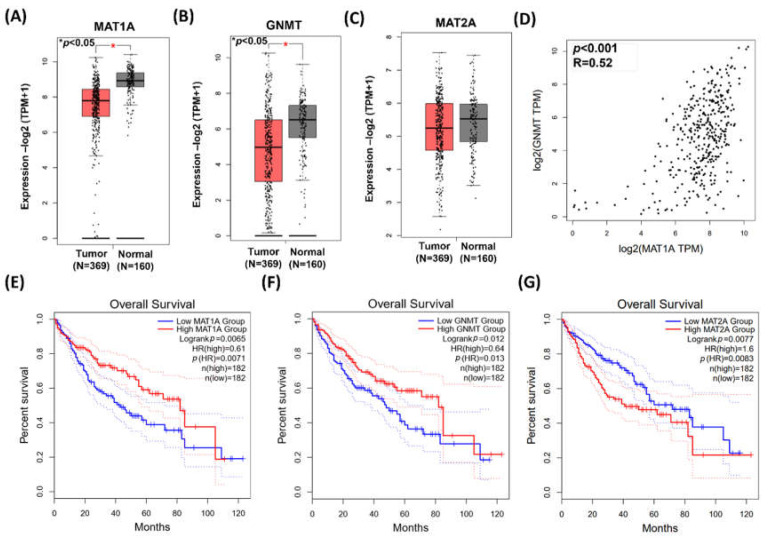
Figure 1.
The expressions of MAT1A, GNMT, and MAT2A in HCC. Gene expression profiling interactive analysis (GEPIA) GEPIA2 database was employed for bioinformatics analysis. (A–C) MAT1A, GNMT, and MAT2A expression in paired tumor and adjacent normal tissue. *, p < 0.05. (D) Pearson’s correlation was used to elucidate MAT1A expression in relation to GNMT expression. (E,F) Kaplan–Meier plots showed that high expression of MAT1A and GNMT (F) are both associated with better overall survival rate of patients with HCC. HR, hazard ratio (G) Kaplan–Meier plot showed that elevated MAT2A expression is associated poor overall survival rate of patients with HCC. HR, hazard ratio.

