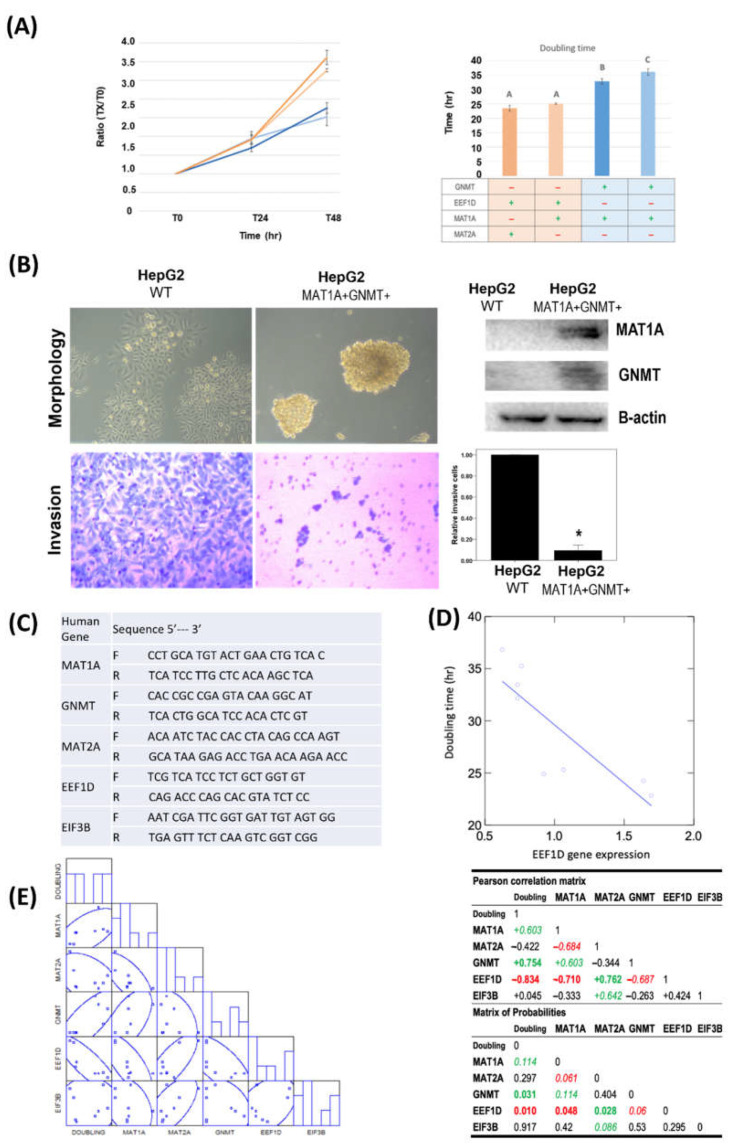
Figure 4.
MAT1A and GNMT expression decreased cell proliferation and invasion in HepG2 cells. MAT1A and GNMT expression also decreased reactome protein EEF1D, and EIF3B mRNA levels. (A) Doubling time of 4 HepG2 derived stable cell lines with various MAT1A and GNMT-expression levels were determined by cell counting. Points, mean; bars, SE. A: Control cells. B: Clone #1, MAT1A and GNMT-overexpressing cells. C: Clone #2, MAT1A and GNMT-overexpressing cells. (B) Overexpression of MAT1A and GNMT decreases invasive ability of HCC cells. MAT1A, GNMT, and β-actin (loading control) protein expression levels were evaluated by immunoblotting in HepG2 and HepG2/MAT1A/GNMT. *, p < 0.05. (C) List of quantitative PCR primers. (D) Pearson’s correlation matrix of GNMT, MAT1A, MAT2A, EEF1D, and EIF3B mRNA expression. (E) Linear plot of correlation estimated from doubling time and EEF1D mRNA expression.

