Figure 2.
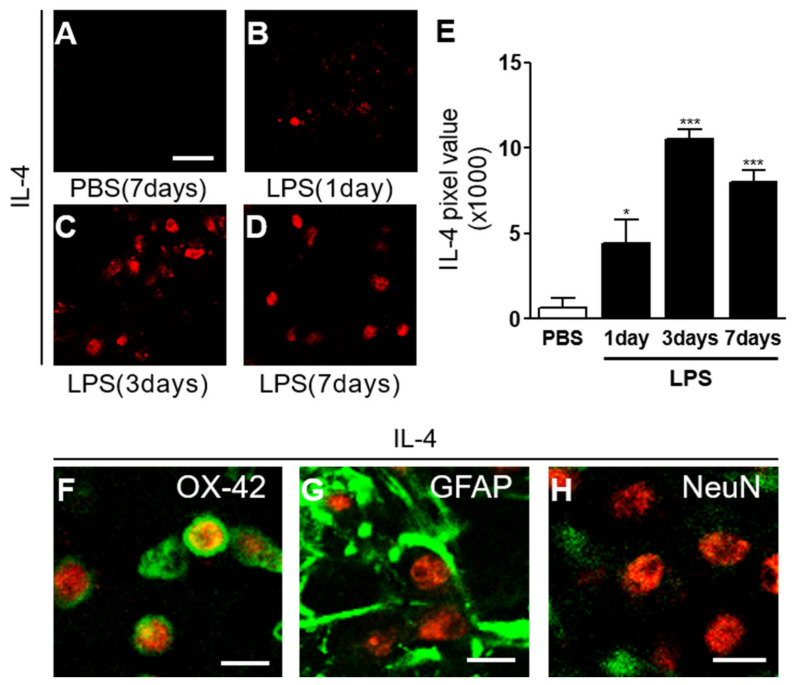
IL-4 expression in LPS-lesioned striatum in vivo. Animals received a unilateral injection of PBS (A) or LPS (B–D) into the rat striatum and were transcardially perfused at various time points. The brain sections were processed for immunohistochemical staining. (A–E) Immunofluorescence images of IL-4 (A–D) and quantification (E) in the rat striatum at indicated time points. Scale bar, 25 µm. * p < 0.05, significantly different from PBS (control). *** p < 0.001 significantly different from PBS-injected control. Mean ± SEM; n of animals = 4 to 6 in each group, ANOVA with Bonferroni test. (F–H) Double immunofluorescence images of IL-4 ((F), red) and OX-42 ((F), green), or IL-4 ((G), red) and GFAP ((G), green), or IL-4 ((H), red) and NeuN ((H), green), and both images are merged (yellow). n of animals = 4. Scale bar, 15 µm.

