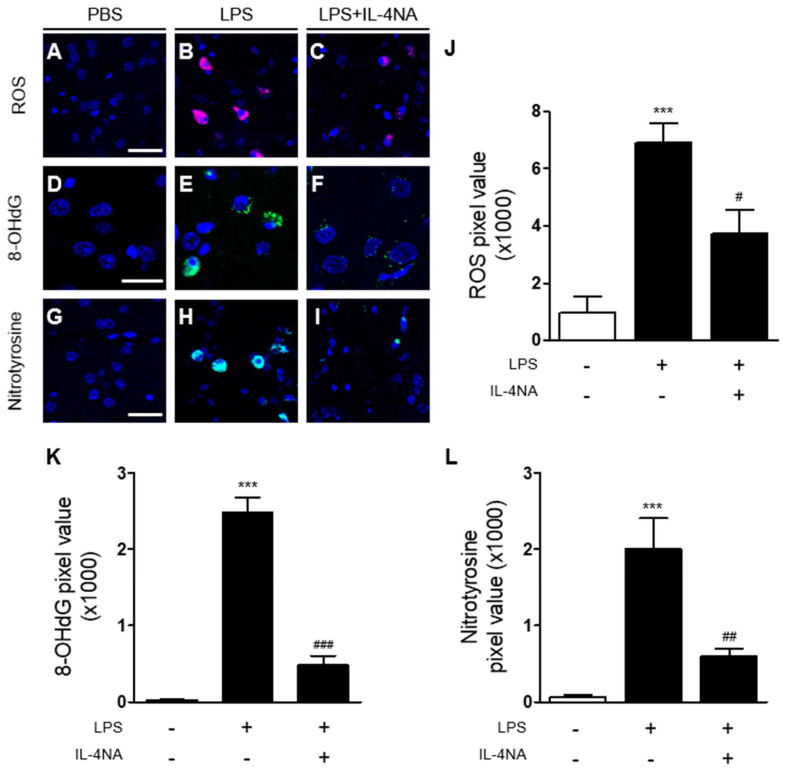
Figure 5.
IL-4 induces oxidative/nitrosative stress in the LPS-injected striatum in vivo. Sections adjacent to those used in Figure 4 were prepared for immunohistochemical staining or hydroethidine histochemistry. (A–C) Hydroethidine histochemistry to detect oxidant production (ethidium fluorescence, red) in the striatum. Nuclei were counterstained with DAPI (blue). Scale bar, 30 µm. (D–F) Immunofluorescence images of 8-OHdG (green) to detect oxidative DNA damage in the striatum. Scale bar, 20 µm. Nuclei were counterstained with DAPI (blue). (G–I) Immunofluorescence images of nitrotyrosine (green) to detect nitrosative damage in the striatum. Nuclei were counterstained with DAPI (blue). Scale bar, 30 µm. (J) Quantification of ROS expression *** p < 0.001, significantly different from PBS. # p < 0.05, significantly different from LPS. Mean ± SEM; n of animals = 4 in each group. ANOVA and Bonferroni analysis. (K) Quantification of 8-OHdG expression *** p < 0.001, significantly different from PBS. ### p < 0.001, significantly different from LPS. Mean ± SEM; n = 4 to 5 in each group. ANOVA and Bonferroni analysis. (L) Quantification of nitrotyrosine expression. *** p < 0.001, significantly different from PBS. ## p < 0.01, significantly different from LPS. Mean ± SEM; n of animals = 5 in each group. ANOVA and Bonferroni analysis.

