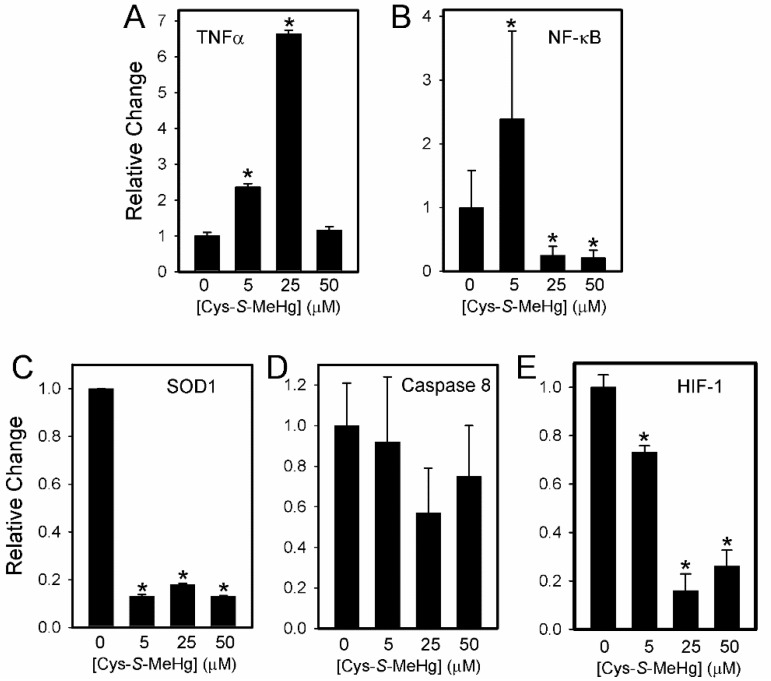
Figure 9.
Indicators of oxidative stress in BeWo cells exposed to MeHg-Cys. BeWo cells were exposed to buffer or 5 µM, 25 mM, or 50 µM MeHg-Cys for 16 h at 37 °C. RNA was isolated from the control and exposed cells and quantitative PCR was used to analyze the expression of TNFα (A), NF-κB (B), SOD1 (C), Caspase 8 (D), and HIF-1 (E). Results are presented as mean ± SE. Data represent 3 experiments performed in triplicate. *, significantly different (p < 0.05) from unexposed cells.

