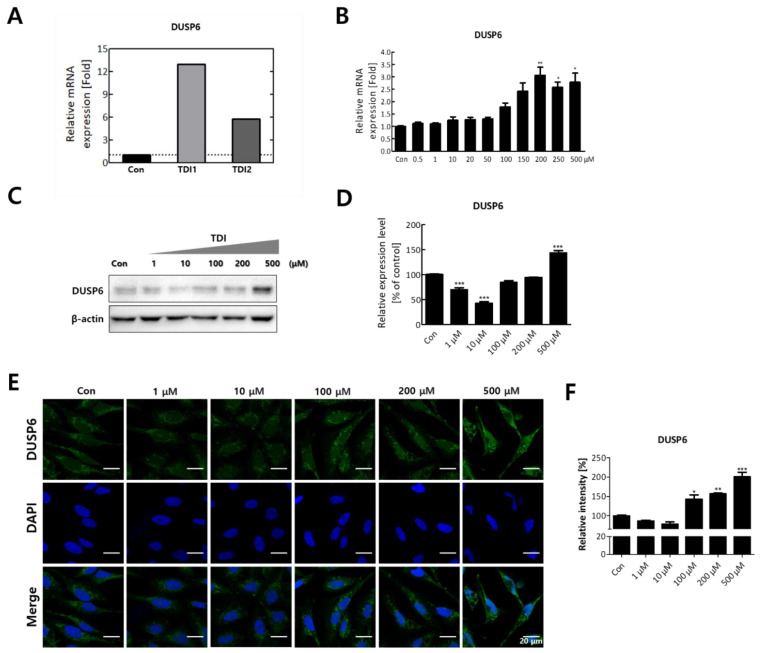
Figure 3.
The expression level of DUSP6 after 24h TDI treatment. (A) mRNA expression level of DUSP6 in 3’ mRNA quantification sequencing results are represented in a bar graph. (B) Gene expression level of DUSP6 was confirmed using quantitative real-time PCR (qRT–PCR). (C) The protein expression level of DUSP6 was measured by western blot analysis, and (D) the western blot quantification is shown as a bar graph. Each result shown represents the mean ± SEM taken from at least three independent experiments. (E) Intracellular DUSP6 and nucleus were stained by CFL 488 and DAPI, respectively. (F) The relative fluorescence intensity of DUSP6 was calculated and expressed in a bar graph. * p < 0.05, ** p < 0.01, *** p < 0.001. TDI1: 10 μM of TDI, TDI2: 200 μM of TDI, Con: control.

