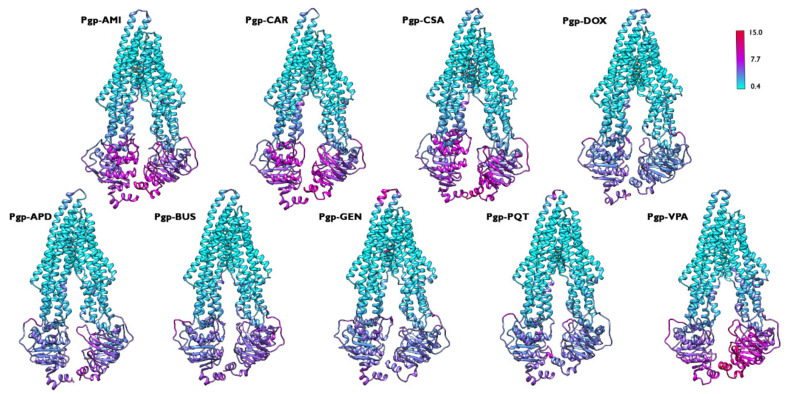
Figure 4.
Backbone RMSF coloured representation for the simulated P-gp–ligand systems along the 500 ns production run. The flexibility scale goes from cyan (lower values) to red (higher values). The same regions are among the most flexible in all of the studied systems; however, the flexibility is higher for the active complexes.

