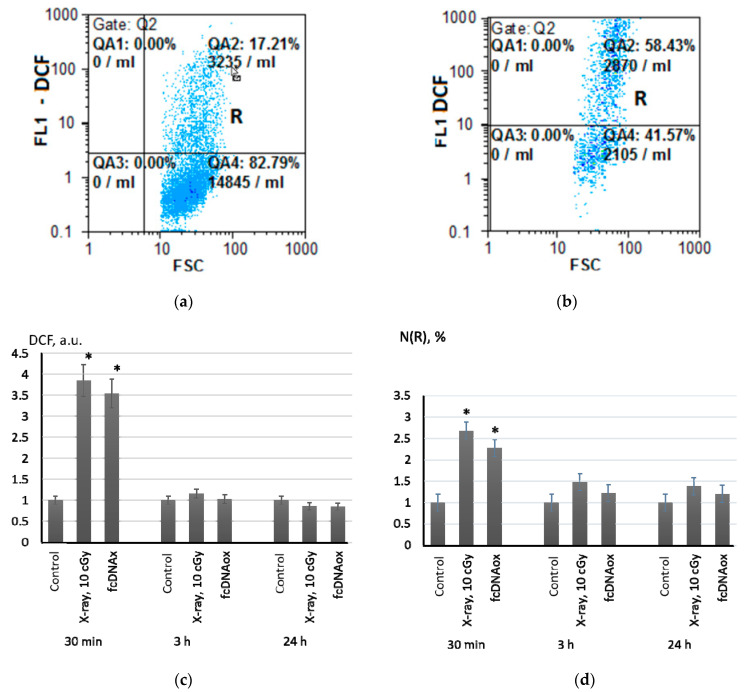
Figure 1.
Intracellular ROS after X-ray radiation (10 cGy) and addition of the standard solution of cfDNAox (50 ng/mL) assessed by flow cytometry with a H2DCFH-DA dye; (a) FL1-DCF versus SSC for the control experiment; (b) FL1-DCF versus SSC for irradiated cells after 30 min; (c) histograms of DCF fluorescence measured by FACS; (d) histograms of R-fraction fluorescence in the MSCs. The histograms were built from three independent measurements on four cell cultures; mean values and standard deviations are given; (*) denotes a significant difference from control experiments, p < 0.001, nonparametric U-test.

