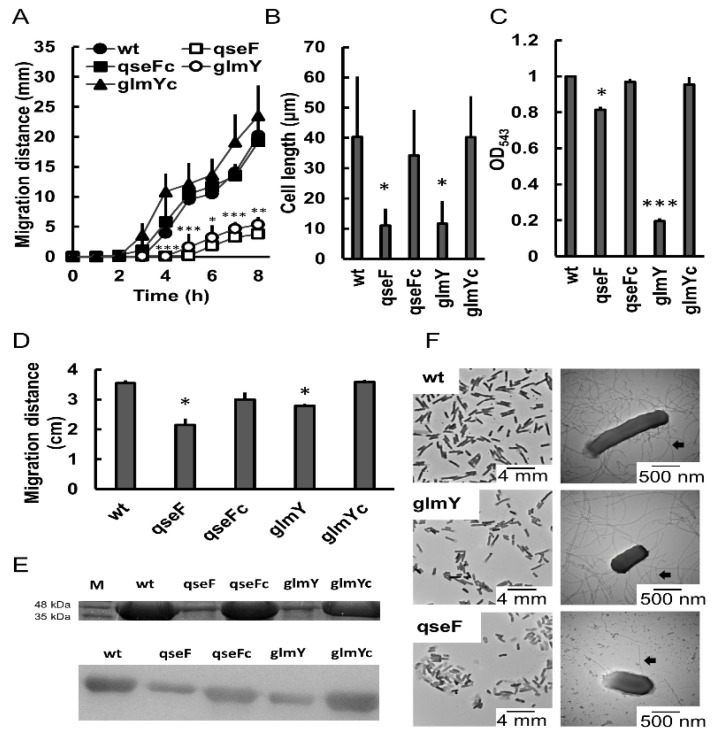
Figure 2.
GlmY and QseF regulated swarming and related phenotypes. Swarming motility (A), cell length (B), hemolysin activity (C) and swimming motility (D) were determined in the wild-type, mutants of qseF and glmY and complemented strains. Swarming migration was monitored at 1-h intervals, and swimming motility was determined after incubation for 16 h. Cell length and hemolysin activity were determined at 5 h after incubation on the LB agar plate. The data are the averages and standard deviations of three independent experiments. Significant difference of qseF or glmY mutant from the wild-type at 4, 5, 6, 7 and 8 h is indicated (* p < 0.05; ** p < 0.01; *** p < 0.001 by the Student’s t test) in (A). Significant difference from the wild-type is indicated (* p < 0.05; *** p < 0.001 by the Student’s t test) in (B–D). (E) Analysis of flagellin expression by SDS-PAGE (upper panel) and Western blotting (lower panel). The flagellin level of the wild-type, mutants of qseF and glmY and complemented strains were examined at 5 h after seeding on the swarming plates by the SDS-PAGE and Western blotting as described in Materials and Methods. The representative picture of three independent experiments is shown. M, molecular weight marker. (F) TEM pictures of wild-type and mutants of qseF and glmY. Bacterial cultures were applied onto a carbon-coated grid, cells were stained with 1% PTA and TEM pictures were taken. Flagella are indicated by arrows. wt, wild-type; qseF, qseF mutant; glmY, glmY mutant; qseFc, qseF-complemented strain; glmYc, glmY-complemented strain.

