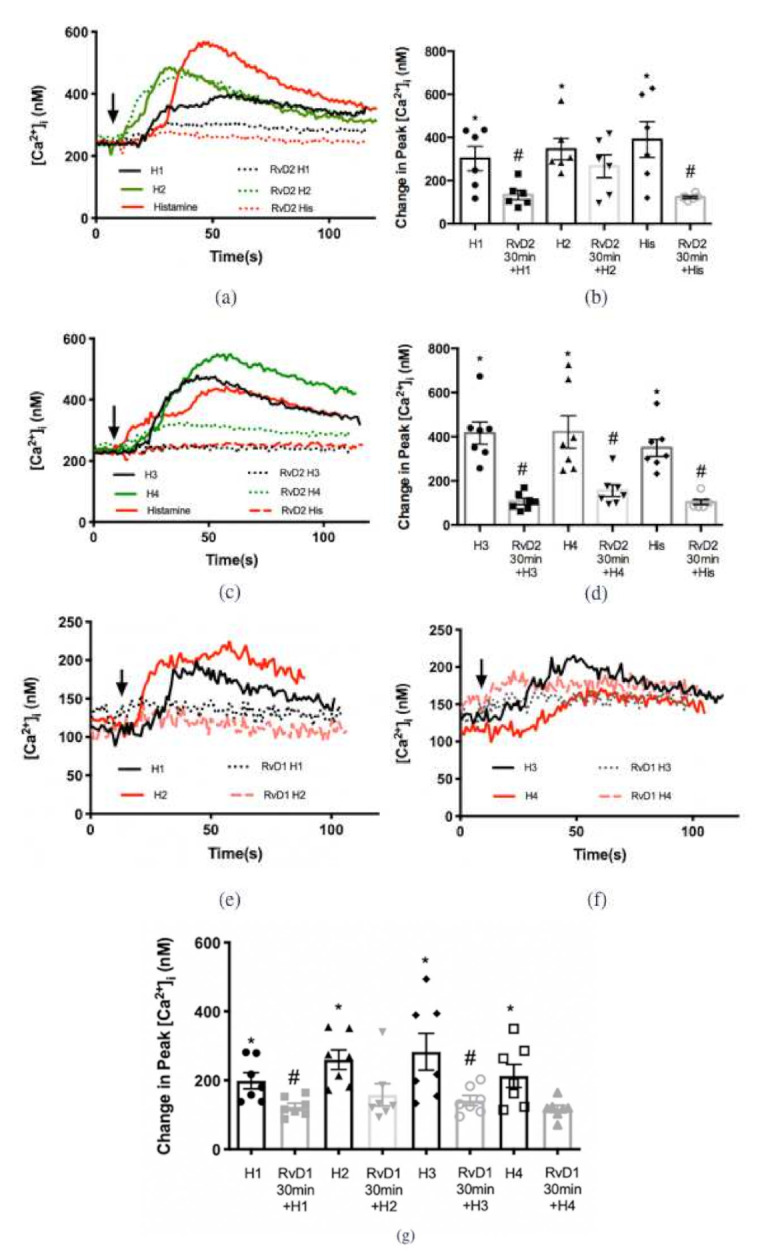
Figure 6.

RvD2 counter-regulates the increase in [Ca2+]i stimulated by histamine receptor 1, 3, and 4 specific agonists, while RvD1 inhibits histamine receptor 1 and 3 specific agonists. Rat goblet cells were treated with an H1 agonist (histamine dimaleate, 10−6 M), H2 agonist (amthamine dihydrobromide, 10−5 M) (a,b, bars 1 and 3), H3 agonist ((R)-(-)-α-methylhistamine, 10−5 M), H4 agonist (4-methylhistamine dihydrochloride,10−5 M) (c,d, bars 1 and 3) or histamine (10−5 M) (a–d, bar 5). Cells were also pretreated with RvD2 (10−8 M) for 30 min prior to the addition of H1 (10−6 M), H2 (10−5 M) (a,b, bars 2 and 4), H3 (10−5 M), H4 (10−5 M) (c,d, bars 2 and 4) specific agonists or histamine (10−5 M) (a–d, bar 6) respectively. Rat goblet cells were treated with an H1 agonist (histamine dimaleate, 10−6 M), H2 agonist (amthamine dihydrobromide, 10−5 M) (e and g), H3 agonist ((R)-(-)-α-methylhistamine, 10−5 M), H4 agonist (4-methylhistamine dihydrochloride, 10−5 M) (f,g, bars 1, 3, 5 and 7, respectively). Cells were also pretreated with RvD1 (10−8 M) (e–g) for 30 min prior to the addition of H1 (10−6 M), H2 (10−5 M) (e,g), H3 (10−5 M), H4 (10−5 M) (f,g, bars 2, 4, 6, and 8, respectively) specific agonists. The average [Ca2+]i over time was shown in (a,c,e,f); change in peak [Ca2+]i was calculated and shown in (b,d,g). Data are mean ± SEM from 6 rats. * Indicates a significant difference from basal. # Indicates a significant difference from stimulus alone. Arrow indicates addition of histamine or histamine receptor subtype agonists.
