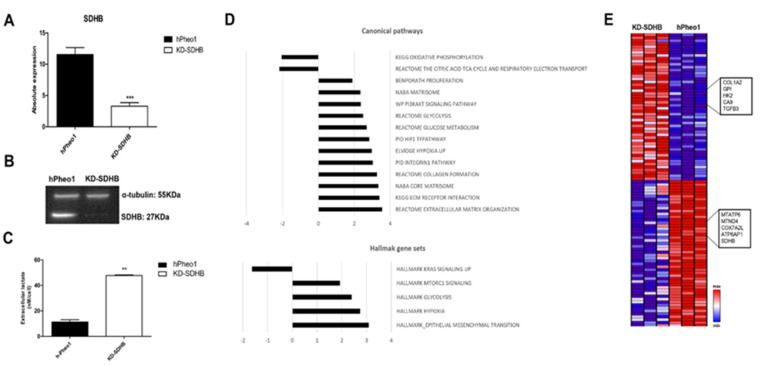
Figure 1.
Effects of knockdown SDHB on hPheo1 cell line. (A) mRNA expression in control (black bar) and KD-SDHB (white bar) hPheo1 cells is presented as absolute quantification with ddPCR; each bar represents the mean ± standard deviation of three independent experiments, *** (p < 0.0001), student’s t-test. (B) Protein expression in hPheo1 (control) and KD-SDHB analyzed with Western blot using antibodies against SDHB and Alpha-tubulin. (C) Lactate concentrations in the medium were measured in KD-SDHB cells and hPheo1 control cells. p value calculated with student’s t-test indicated as ** (p < 0.001). (D) Top-ranked gene sets in the Canonical Pathways and Hallmark sets (up/down regulated). (E) Hierarchical clustering of hPheo1 and KD-SDHB cell lines based in mRNA expression levels. The normalized expression 2-log is displayed with z scores and altered expressed genes belong to glycolysis, hypoxia, cell proliferation, cell differentiation, and oxidative phosphorylation gene pathways.

