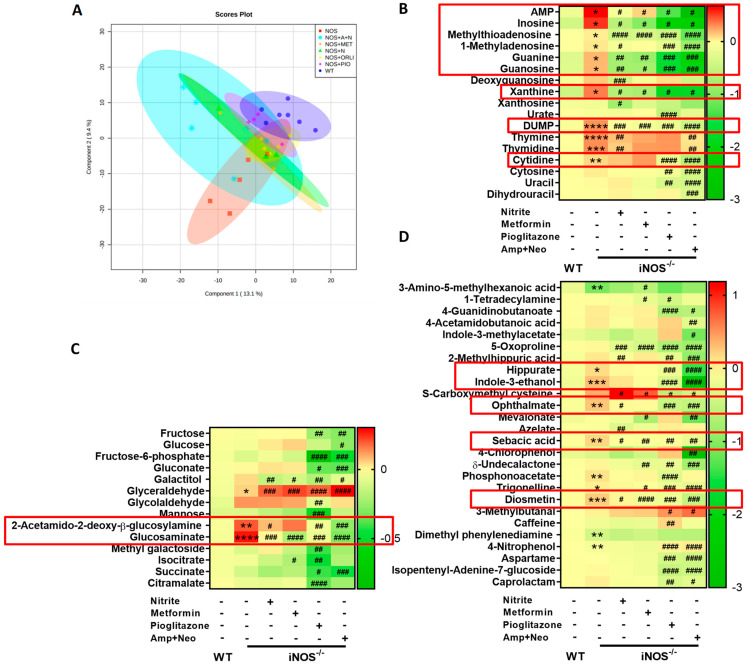
Figure 5.
Alterations in the serum metabolome of iNOS-/- mice following treatment with various interventions. Serum metabolomic analysis in chow fed WT, iNOS-/- and iNOS-/- mice treated with various interventions in ESI (+) mode (A) PLS-DA score plot. Heat map of differential metabolites identified by metabolomics analysis related to (B) Nucleic acids metabolism, (C) Carbohydrate metabolism and (D) Miscellaneous/microbiota derived metabolites. Data are represented as mean (n ≥ 4). * p < 0.05, ** p < 0.01, *** p < 0.001, **** p < 0.0001 vs. WT; # p < 0.05, ## p < 0.01, ### p < 0.001 and #### p < 0.0001 vs. iNOS-/-.

