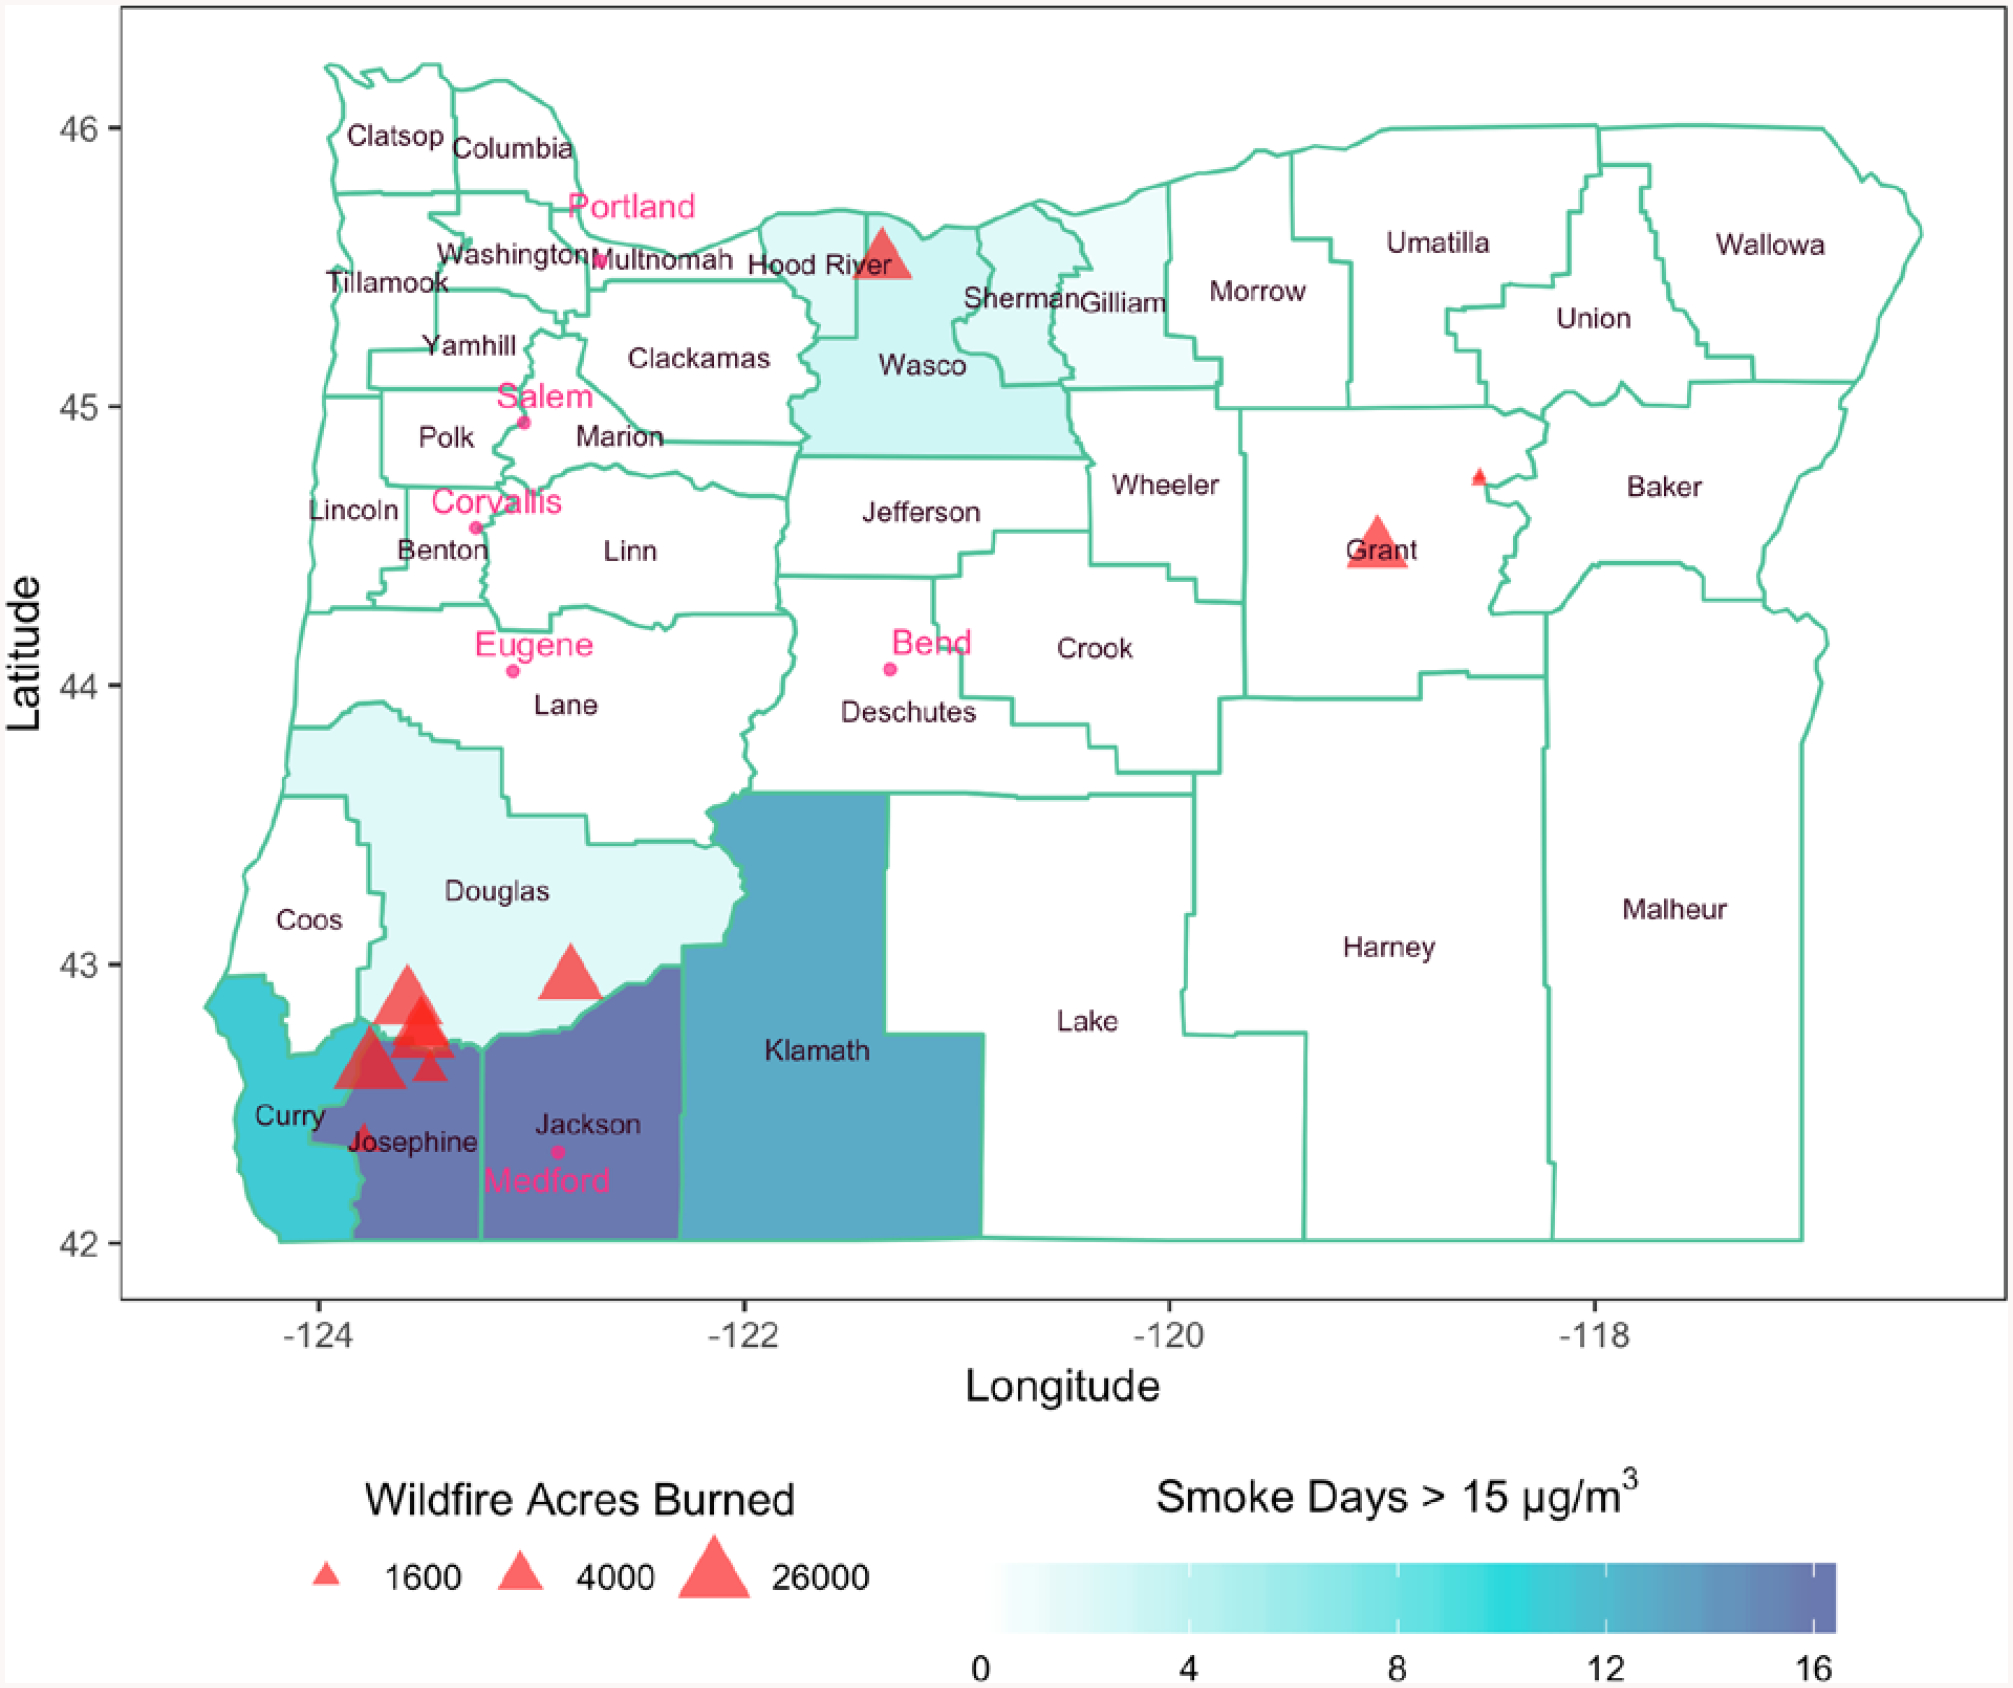
Figure 1:

Number of smoke-impacted days where WFS PM2.5 > 15 μg/m3 in Oregon State counties from 2013-05-01 to 2013-09-30. Fire locations are represented by triangles and are proportional to acres burned by the fire. Metropolitan areas are represented by circles.
