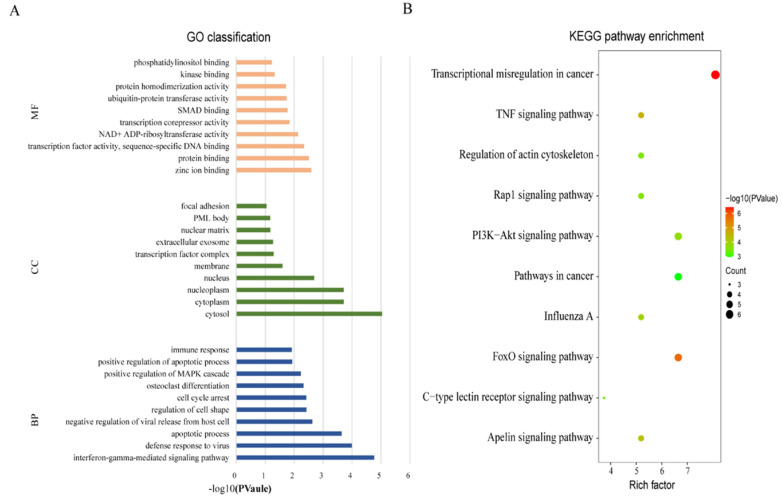
Figure 3.
GO classification and KEGG pathway enrichment analysis of the candidate targets. (A) GO classification of the targets of unique DE-miRNAs in MTB-1458 groups were analyzed by DAVID 6.8 online database with default settings. The top 10 terms are displayed. (B) KEGG pathway enrichment analysis of the targets of unique DE-miRNAs in MTB-1458 groups was analyzed by KONAS 3.0 online database with default settings. The top 10 terms are displayed. Rich factor = enriched genes/total genes. The bubble size represents the number of enriched genes, and the color of the bubble represents −log10 (p-value).

