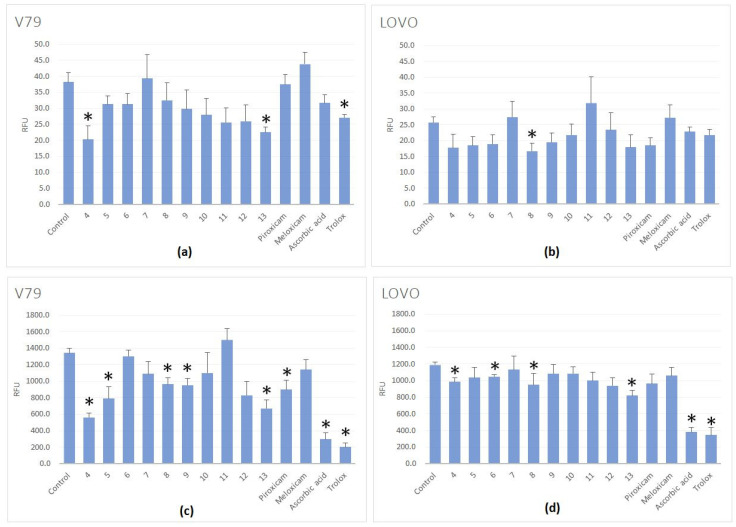
Figure 2.
ROS levels in V79 and LOVO cells incubated in the presence of tested compounds (in concentration of 100 μM): untreated with H2O2 (a,b) and treated with H2O2 (100 μM, 30 min) (c,d). Results are presented as RFU (relative fluorescent units) of fluorescence levels. The statistical significance of the differences between the results for the tested compounds, compared to the control, was calculated using Tukey’s post hoc test (* p < 0.05).

