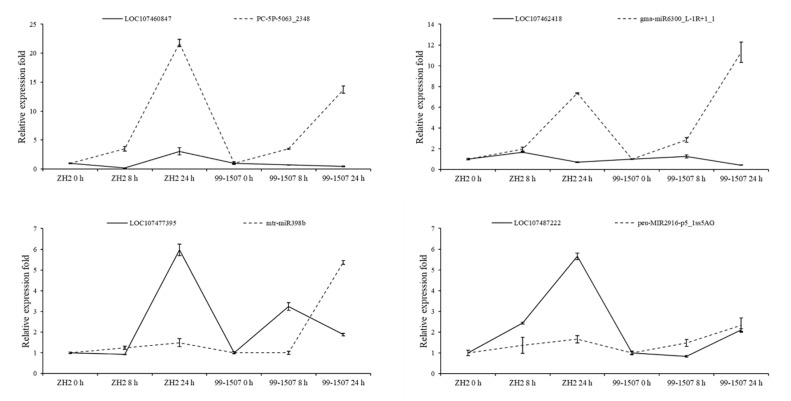
Figure 8.
Expression correlation between miRNAs and their targets at six different durations of Al treatment. The thin and thick lines indicate miRNAs and accordingly targets abundance, respectively. To standardize RNA quantity for evaluating relative expression levels, U6 and actin were used as the internal reference genes of miRNAs and their targets, respectively. The expression level at 0 h in each sample was used as reference state, which was set to 1, and fold change values were shown here.


