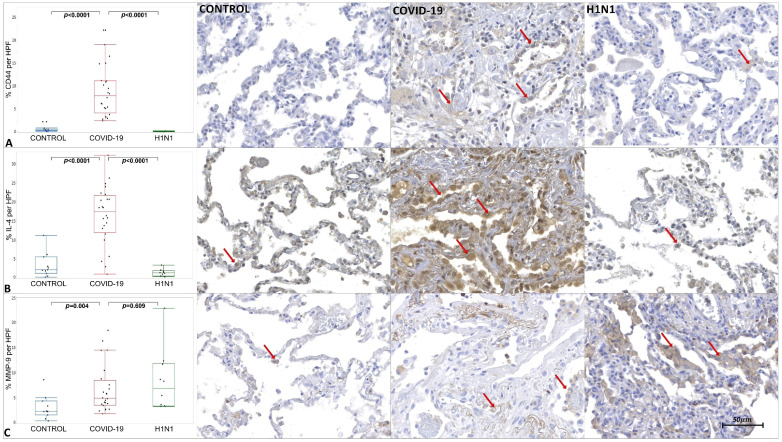
Figure 2.
Graphics show tissue immunoexpression of CD44v6, IL-4, and MMP-9 (percentage per HPF). (A) Comparative graphs between the CONTROL, COVID-19 and H1N1 groups and photomicrographs of tissue immunoexpression of CD44v6 in alveolar epithelium represented by the red arrow, of the respective groups. (B) Comparative graphs between the CONTROL, COVID-19 and H1N1 groups and photomicrographs of tissue immunoexpression of IL-4 in the alveolar epithelium, represented by the red arrow, of the respective groups. (C) Comparative graphs between the CONTROL, COVID-19 and H1N1 groups and photomicrographs of tissue immunoexpression of MMP-9 in the alveolar epithelium, represented by the red arrow, of the respective groups.

