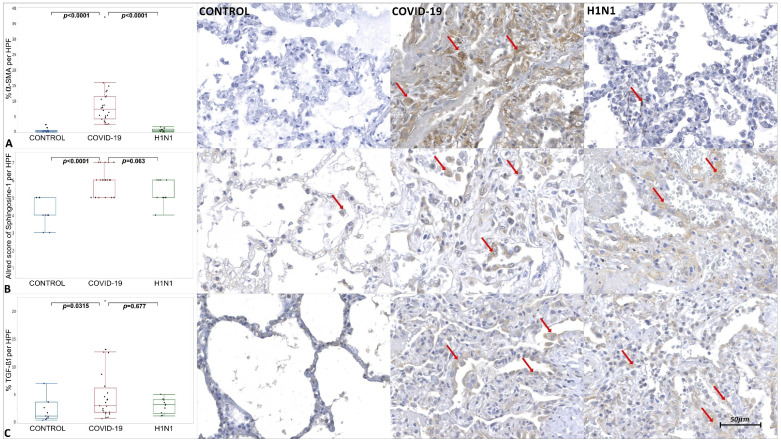
Figure 3.
Graphics show tissue immunoexpression of α-SMA and TGF- β1 (percentage per HPF) and Sphingosine-1 (M2 macrophages and type II pneumocytes Allred score). (A) Comparative graphs between the CONTROL, COVID-19 and H1N1 groups and photomicrographs of tissue immunoexpression of α-SMA in alveolar epithelium represented by the red arrow, of the respective groups. (B) Comparative graphs between the CONTROL, COVID-19 and H1N1 groups and photomicrographs of tissue immunoexpression of Sphingosine-1 M2 macrophages and type II pneumocytes, represented by the red arrow, of the respective groups. (C) Comparative graphs between the CONTROL, COVID-19 and H1N1 groups and photomicrographs of tissue immunoexpression of TGF- β1 in the alveolar epithelium, represented by the red arrow, of the respective groups.

