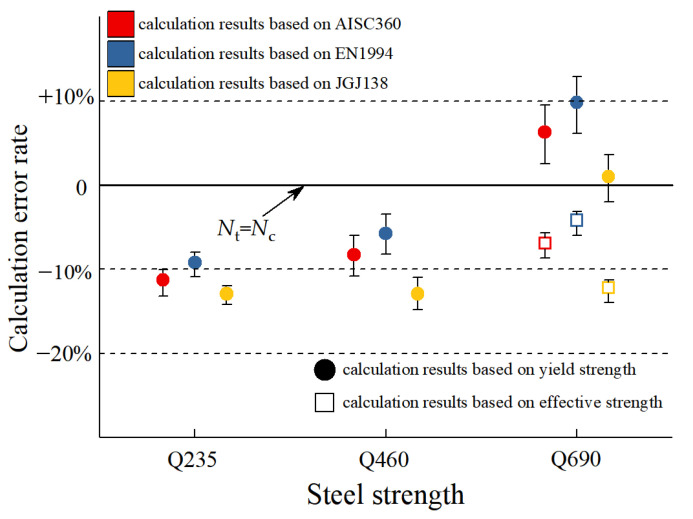
Figure 19.
Influence of strength limit of steel on calculation results. Nc and Nt represent the calculation results of the bearing capacity and the test bearing capacity. Color (red, blue, and yellow) is used to distinguish different standards. Shapes (solid circles and hollow squares) used to distinguish steel strength values.

