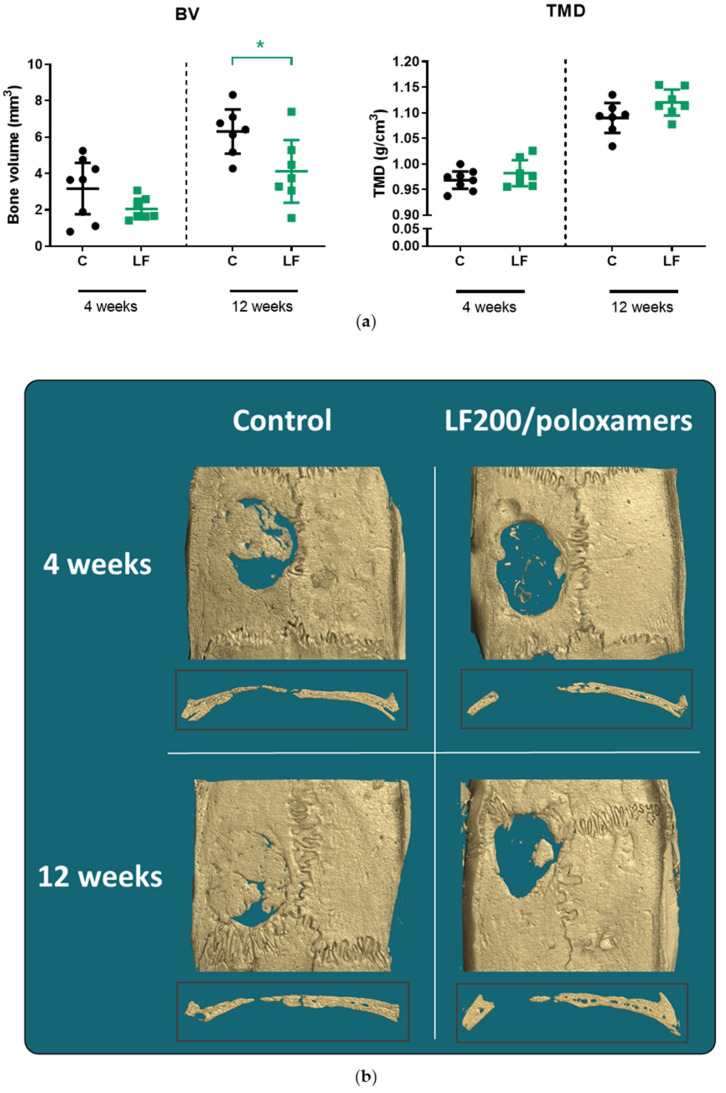
Figure 5.
MicroCT results of rat calvariae at 4 and 12 weeks postoperation. (a) Bone volume and tissue mineral density of the control and LF200/poloxamer groups. C, Control; LF, LF200/poloxamer; BV, bone volume; TMD, tissue mineral density. Data shown are the mean ± 95% CI; two-way ANOVA with post hoc Dunnett’s test, * p < 0.05 versus the control at that time point. (b) Reconstructed bone images of rat calvariae using the microCT data. The median bones from the bone volume data in each group are presented with cross-section at the middle of the defect area.

