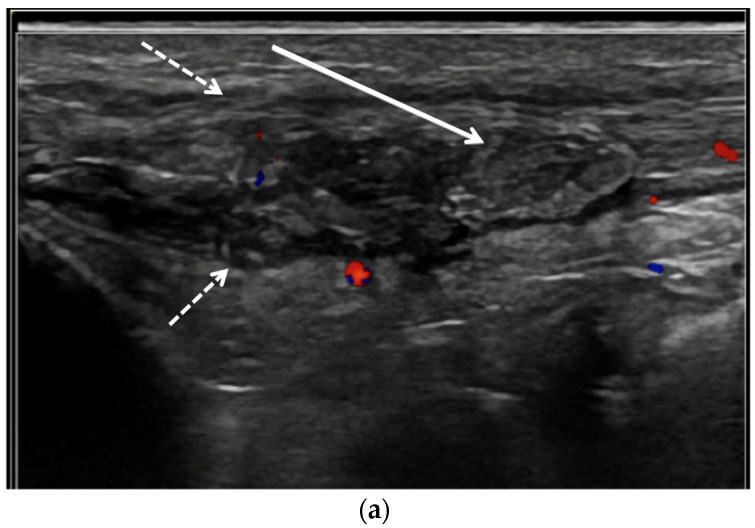
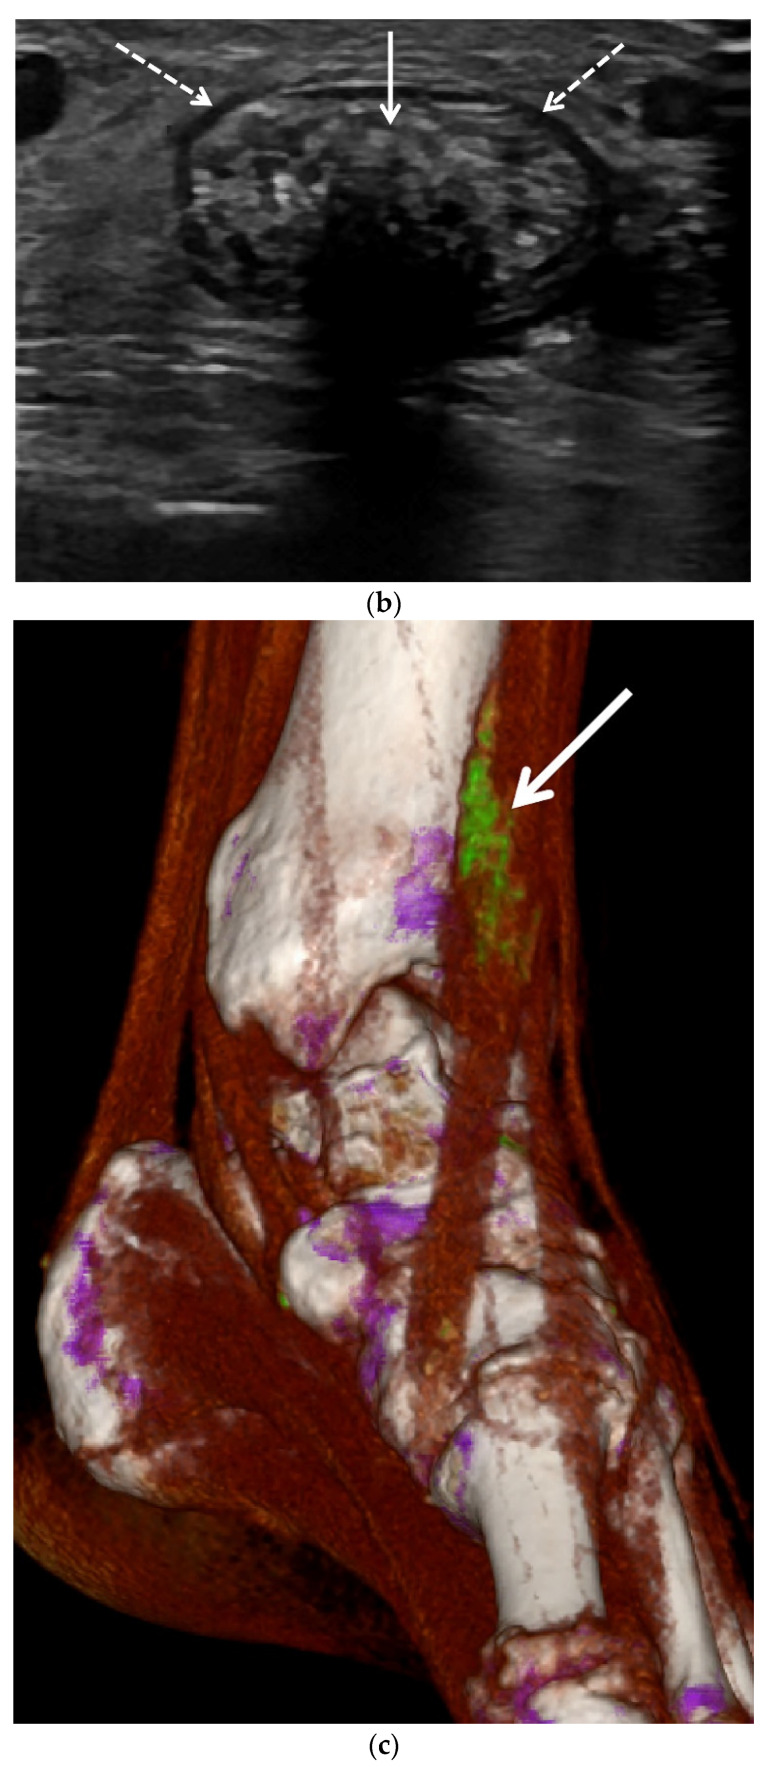
Figure 10.
Gout of the tibialis anterior tendon. (a) Long-axis color Doppler US image along the dorsal aspect of the ankle and (b) short-axis gray scale US image of the tibialis anterior tendon in the same region show marked thickening and heterogeneous echogenicity of the tibialis anterior tendon consistent with severe tendinopathy and MSU crystal deposition (dashed arrows) with a more discrete echogenic focus of tophaceous gout (arrows) with posterior shadowing in (b). (c) A 3D reformatted dual energy CT (DECT) image of the ankle shows green encoded foci in the tibialis anterior tendon-related MSU crystal deposition concordant with US findings. DECT image acquired at 0.8–1.5 mm on a dual energy Siemens Somatom Force helical CT scanner using Syngovia post-processing software to demonstrate MSU crystals encoded in green.


