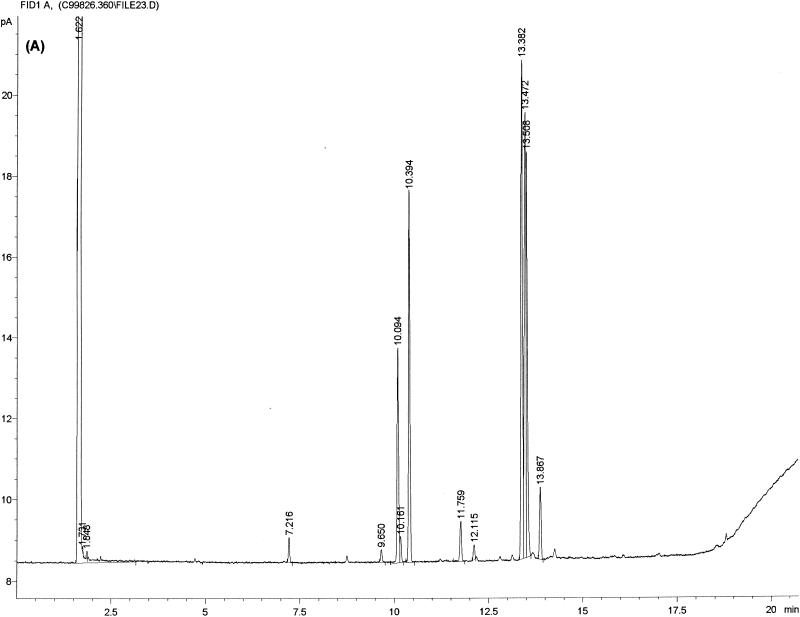
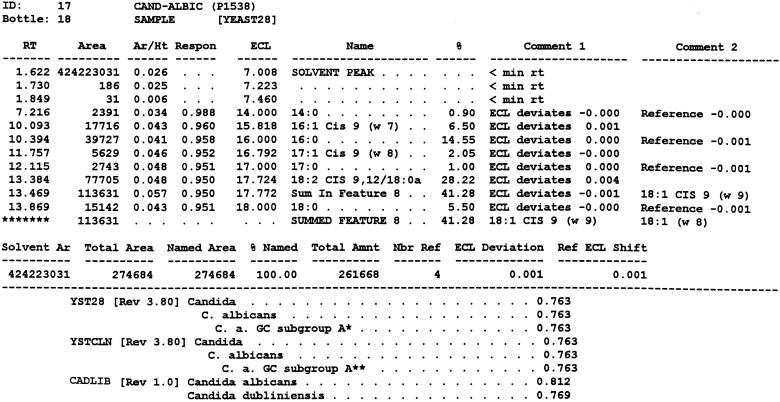
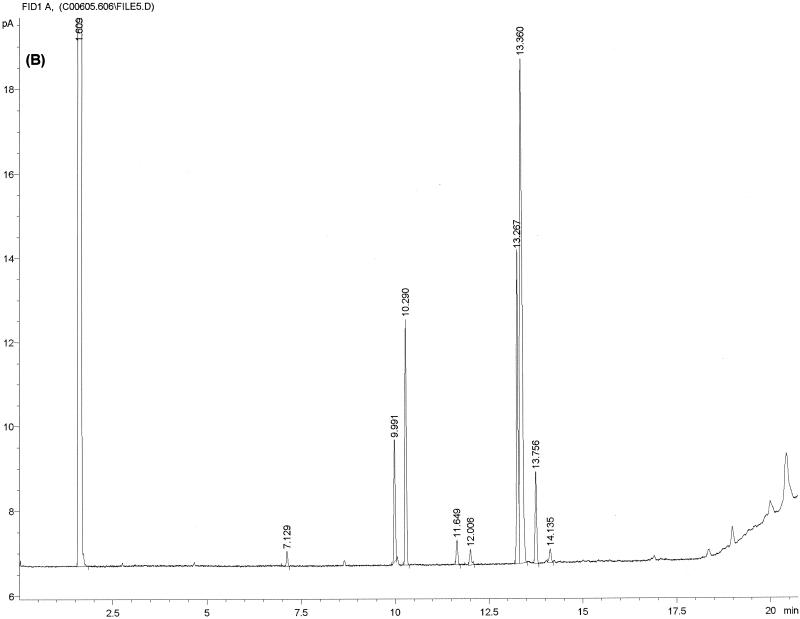
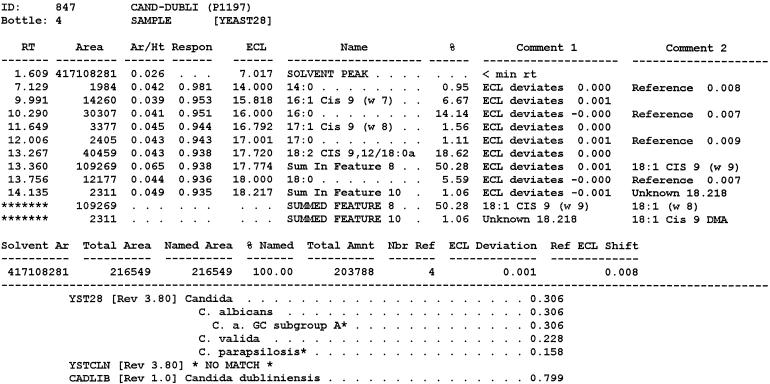
FIG. 1.
Typical chromatogram and MIS report using FAME analysis and YEAST28 method. (A) C. albicans DSM 11943; (B) C. dubliniensis CBS 7987T. The MIS report comprises the chromatogram, the composition report (text above the continuous dotted line) and library search report (text below the continuous dotted line). In the composition report each peak of the chromatogram is listed by retention time (RT), area, and area/height ratio (Ar/Ht). A linear interpolation of each peak's retention between two saturated straight-chain FAME reference peaks is referred to here as equivalent chain length (ECL). The MIS software compares the ECL of each peak in the analysis with the expected ECL of the fatty acids (results are found in the column Name). After the peak areas are modified by the quantitative response factor (Respon) and normalized to 100%, the resulting weight is listed as a percentage (%). The library search report lists the most likely matches by searching the loaded libraries and provides an SI (for details, see Discussion) for each of them. A high SI (>0.5) indicates a good match. The commercially available yeast libraries Yeast28 (YST28) (preferentially for identification of environmental yeast isolates) and Yeast Clinical (YSTCLN, preferentially for identification of clinical yeast isolates) and the newly created entry CADLIB (intended for differentiation between C. albicans and C. dubliniensis) were used.


