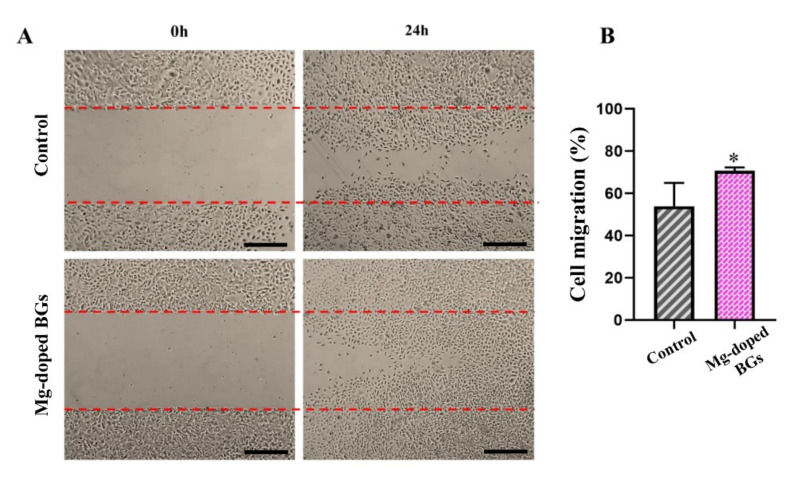
Figure 8.
(A) The migration rate of HUVECs incubated with or without Mg-doped crushed scaffolds after 0 h and 24 h. (B) The graph showing the migratory effects of Mg-doped crushed scaffolds on HUVECs in comparison to the un-treated cells (control). (n = 3, values are represented as mean ± SD, and * p < 0.05 for Mg-doped BGs compared to control. Scale bars: 100 µm).

