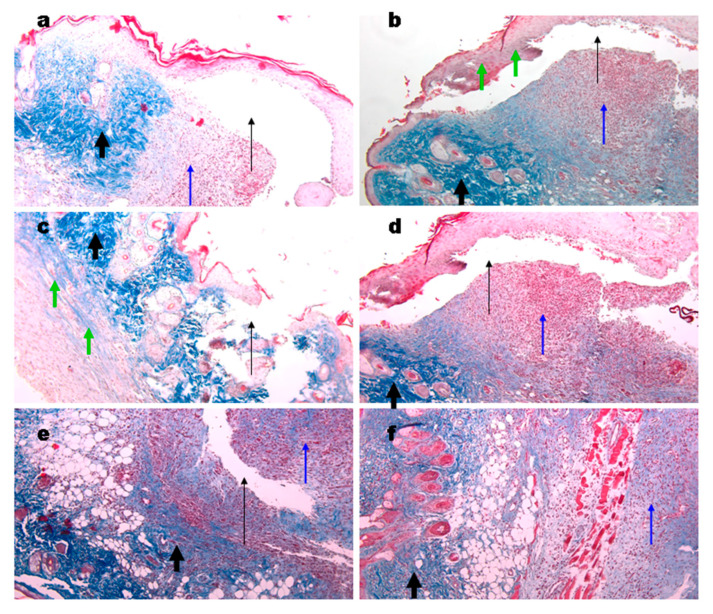
Figure 9.
Representative images of the Masson’s trichrome staining of the wound biopsies in mice treated with gels. Wounds at day 6 using Ch700-G (a), Ch700-Col 1:1 (b), Col (c), and NPs (d). Day 10 wounds in control (e) and in Col mice (f). Thin black arrows show open cavities; thick black arrows show collagen deposition; thin blue arrows show granulomatous tissue; and green arrows show collagen originated from the gels. Magnification 100×.

