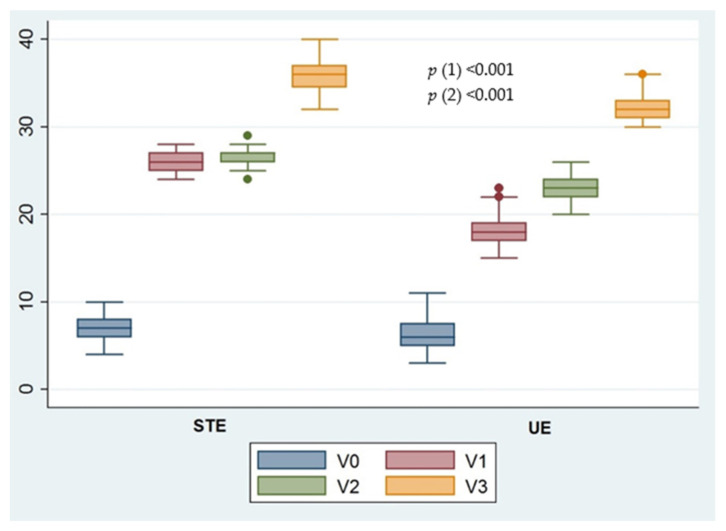
Figure 2.
Evolution of the main outcome (fatigue) since the baseline for each intervention group. STE: Supervised therapeutic exercise; UE: Unsupervised exercise. p-value (1), Greenhouse-Geisser correction to contrast the mean change throughout the assessment visits. p-value (2), Greenhouse-Geisser test to verify whether the evolution of the FACIT-F score is similar in the STE and UE groups.

