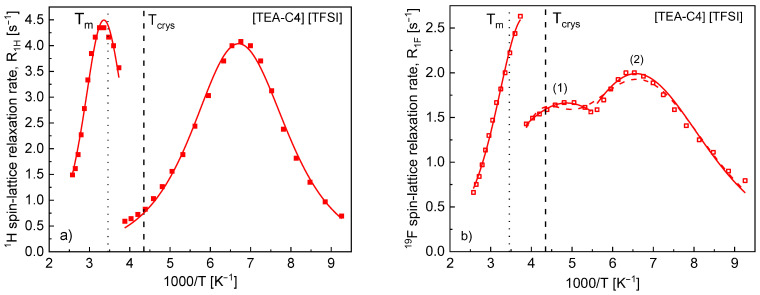
Figure 2.
1H (a) and 19F (b) spin-lattice relaxation rates versus reciprocal temperature for [TEA-C4] [TFSI]. Solid lines—fits with parameters collected in Table 1, dashed red line—fit with parameters give in the text, vertical lines indicate phase transition temperatures ( = 229.89 K and = 289.10 K denote the crystallization and melting temperatures [26], respectively).

