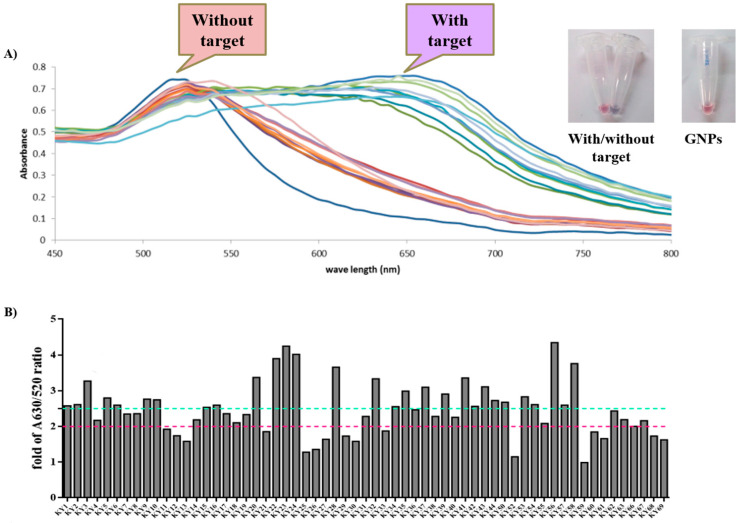
Figure 1.
GNPs-based colorimetric results. (A) The spectra of HIV-1 RTs in the presence and absence of KY DNA aptamers. Each color line represent for GNPs-based colorimetric assay in with or without HIV-1 RT. (B) Fold change of DNA aptamers when complexed with KY HIV-1 RT. Green line at cutoff 2.5-fold change and pink line at cutoff 2.0-fold change.

