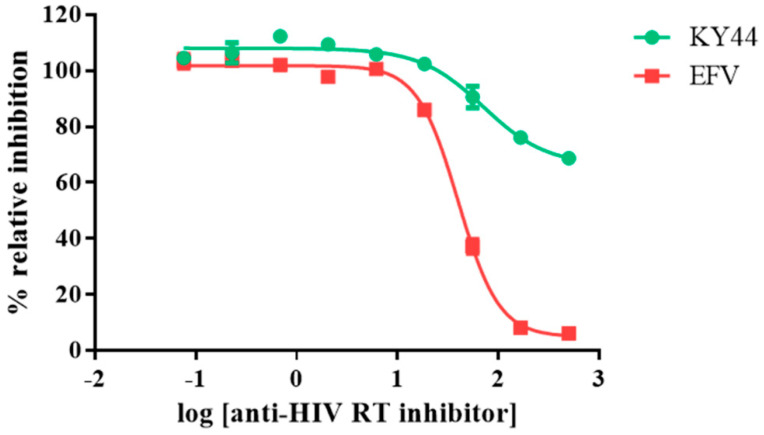
Figure 5.
Cytotoxicity testing of HIV inhibitors on HEK293 cells survival. The green line represents KY44 and the red line represents EFV. Y axis showed the % relative inhibition to untreated cells. X axis showed log concentration of HIV-1 RTs inhibitors. At the high concentration, EFV and KY44 were toxic to HEK293 cells at around 100 and 20% relative inhibition, respectively. Data are represented as the mean ± SD (n = 3).

