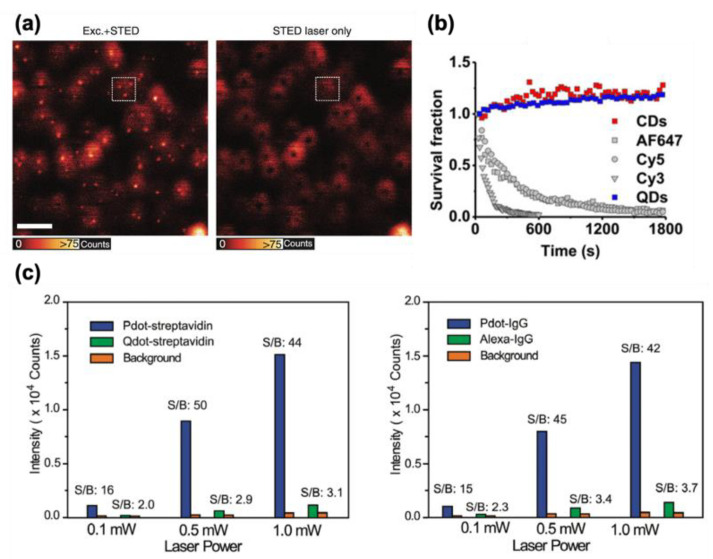
Figure 6.
(a) Left: Qdot705 imaged with STED nanoscopy, i.e., with both the STED and the excitation beam. Right: The same sample imaged only with the doughnut-shaped STED beam. (b) Survival fraction during continuous STED illumination compared for different types of fluorescence probes. (c) Left: Average fluorescence brightness and SNR of Pdot−streptavidin and Qdot−streptavidin. Right: Average fluorescence brightness and SNR of Pdot−IgG and Alexa 488−IgG. (a) Reprinted (adapted) with permission from [27]. Creative Commons Attribution 4.0 International License. (b) Reprinted (adapted) with permission from [106]. Copyright 2021 American Chemical Society. (c) Reprinted (adapted) with permission from [111]. Copyright 2021 American Chemical Society.

