Figure 1.

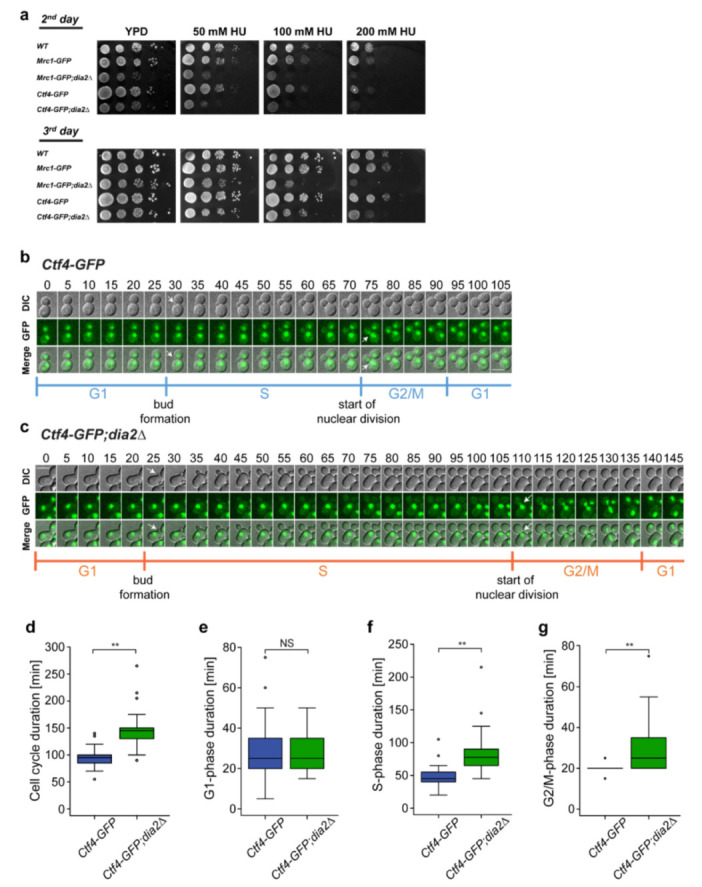
Dia2 deficiency increases the length of the cell cycle due to prolonged S- and G2/M-phases. (a) Viability test: S. cerevisiae cells from the Ctf4-GFP, Ctf4-GFP;dia2Δ, Mrc1-GFP, Mrc1-GFP;dia2Δ, and control wild-type S288C strains were tested by 10-fold serial dilution assay. A total of 5 μL of each dilution were spotted onto YPD or YPD supplemented with 50 mM, 100 mM, and 200 mM HU. The images represent cell growth on the second and third day of incubation. (b) Live-cell imaging of an entire cell cycle of a typical cell expressing nuclear localized Ctf4-GFP protein. Visualization of the whole cell and nucleus is obtained by DIC and GFP, respectively. Frames were taken every 5 min and maximum intensity projection of 11 z-planes was applied. Arrows indicate the onset of bud formation (G1-to-S transition) and the start of nuclear division (S-to-G2/M transition). The scale bar is 5 μm. (c) Live-cell imaging of an entire cell cycle of a typical cell from the Ctf4-GFP;dia2Δ represented in the same way as (b). (d–g) Mean value ± standard deviation of the duration of the entire cell cycle, G1-, S-, G2/M-phases of Ctf4-GFP (n = 50) and Ctf4-GFP;dia2Δ (n = 50). The two-tailed Wilcoxon–Mann–Whitney test was used to evaluate statistical significance; ** p < 0.001; NS (non-significant) p > 0.01.
