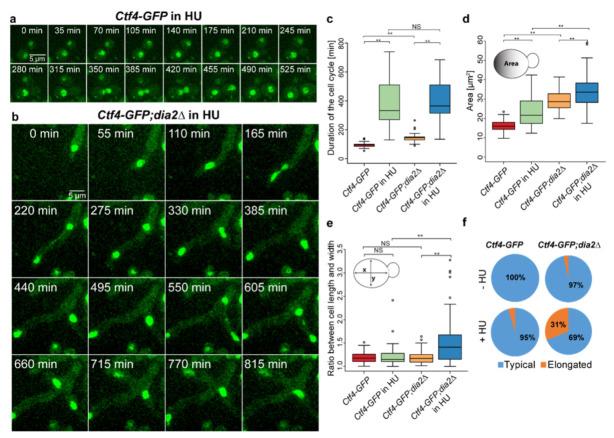
Figure 5.
Effect of DNA synthesis inhibition on cell size and morphology. (a,b) Time-lapse live-cell imaging of Ctf4-GFP and Ctf4-GFP;dia2Δ yeast cells in HU, respectively. (c) Duration of the cell cycle with and without HU (n = 50). (d) Area of the cells (n = 90) from Ctf4-GFP and Ctf4-GFP;dia2Δ with and without HU treatment. (е) Long-to-short (x-to-y) axis ratio (n = 90) of Ctf4-GFP and Ctf4-GFP;dia2Δ with and without HU treatment. (f) Proportions of elongated and typical cells of Ctf4-GFP and Ctf4-GFP;dia2Δ with and without HU treatment. The two-tailed Wilcoxon–Mann–Whitney test was used to evaluate statistical significance; ** p < 0.001; NS (non-significant) p > 0.01 and mean value ± standard deviation was used.

