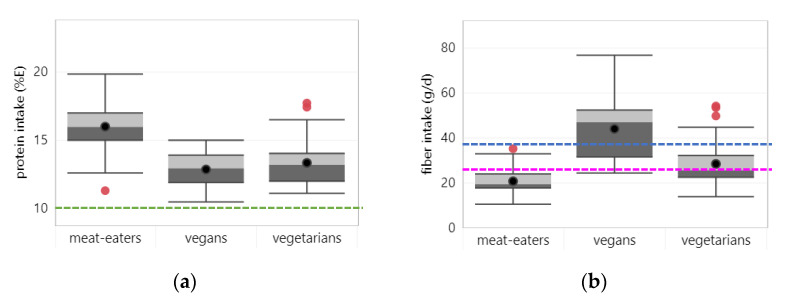
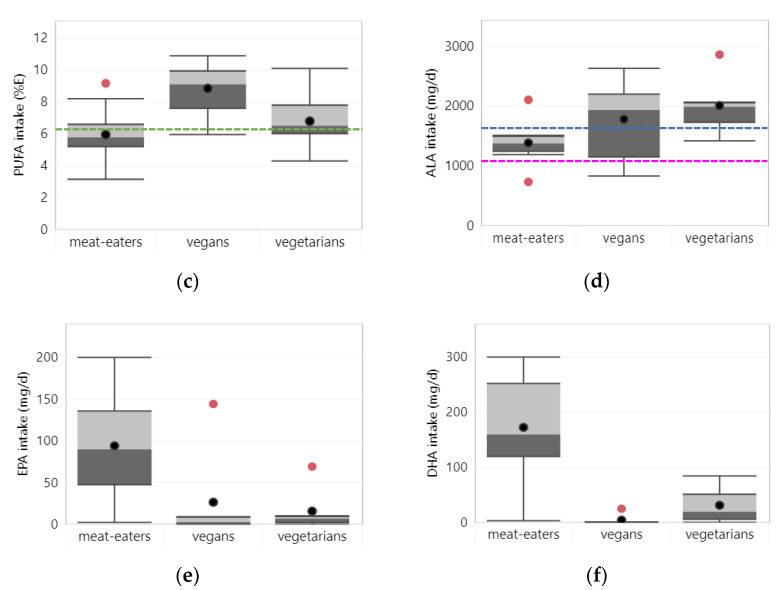
Figure 2.
Boxplots represent 25, 50 and 75 percentiles of intake with whiskers at <1.5 interquartile range (IQR) per diet group; black dots represent mean intake and red dots outliers >1.5 IQR: (a) protein—dotted lines represent the lower limit of the acceptable macronutrient distribution range; (b) fiber—blue and pink dotted lines represent adequate intakes for men and women respectively; (c) polyunsaturated fatty acids (PUFA)—dotted line represents lower acceptable macronutrient distribution range; (d) α-linolenic acid (ALA)—blue and pink dotted lines represent adequate intakes for men and women respectively; (e) eicosapentaenoic acid (EPA); (f) docosahexaenoic acid (DHA).


