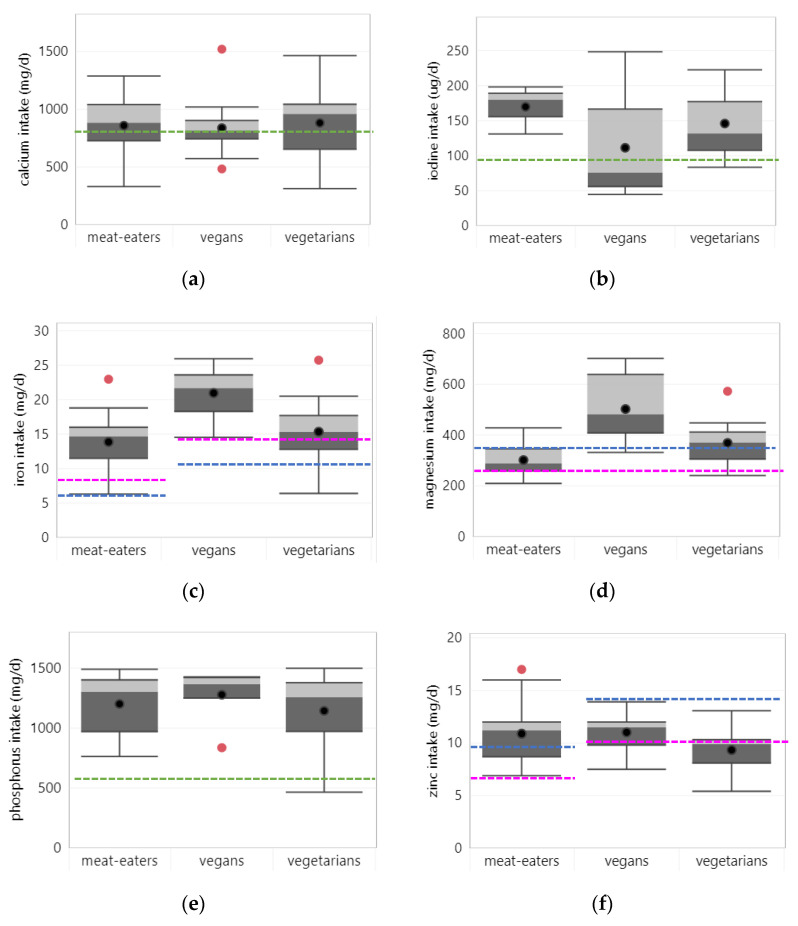
Figure 4.
Mineral intake per diet group. Boxplots show 25, 50 and 75 percentiles of intakes with whiskers at <1.5 interquartile range (IQR); black dots represent mean intake and red dots outliers >1.5 IQR; dotted lines represent the estimated average requirement (EAR) for adults (green), women (pink) and men (blue): (a) calcium; (b) iron, EAR for vegans and vegetarians is adjusted for lower iron bioavailability; (c) iodine; (d) magnesium; (e) phosphorus; (f) zinc, EAR for vegans and vegetarians is adjusted for lower zinc bioavailability.

