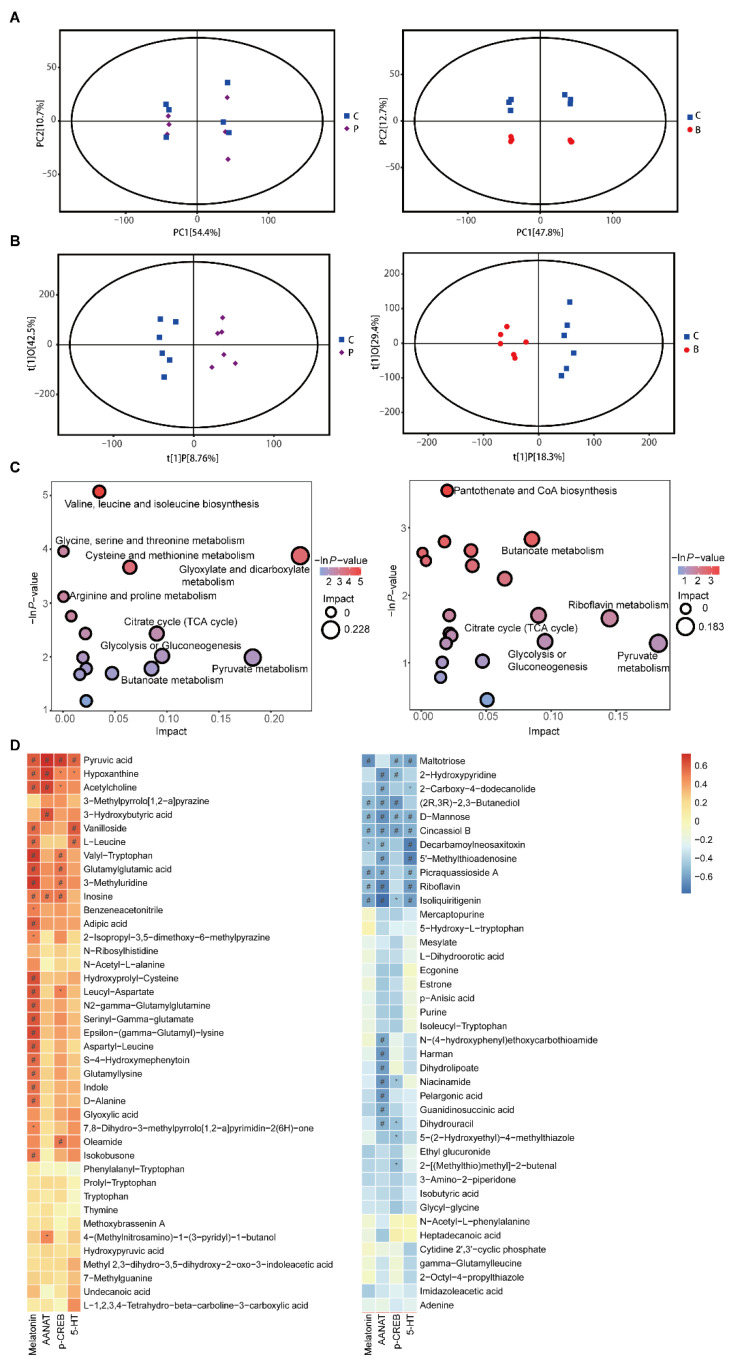
Figure 6.
Metabolomics in BON-1 cell supernatant after propionate or butyrate treatment. (A) Score plots of the principal component analysis (PCA) model between the propionate group and the control group (left) and between the butyrate group and the control group (right). (B) Score plots of the orthogonal projections to latent structure-discriminant analysis (OPLS-DA) model between the propionate group and the control group (left) and between the butyrate group and the control group (right). (C) Bubble plots of pathway analysis between the propionate group and the control group (left) and between the butyrate group and the control group (right). (D) Correlation analysis between levels of different metabolites and those of melatonin, AANAT, p-CREB, and 5-HT in the supernatant of BON-1 cells. *, p < 0.05 and r ≥ 0.5; #, p < 0.05 and r < 0.5 (n = 6).

