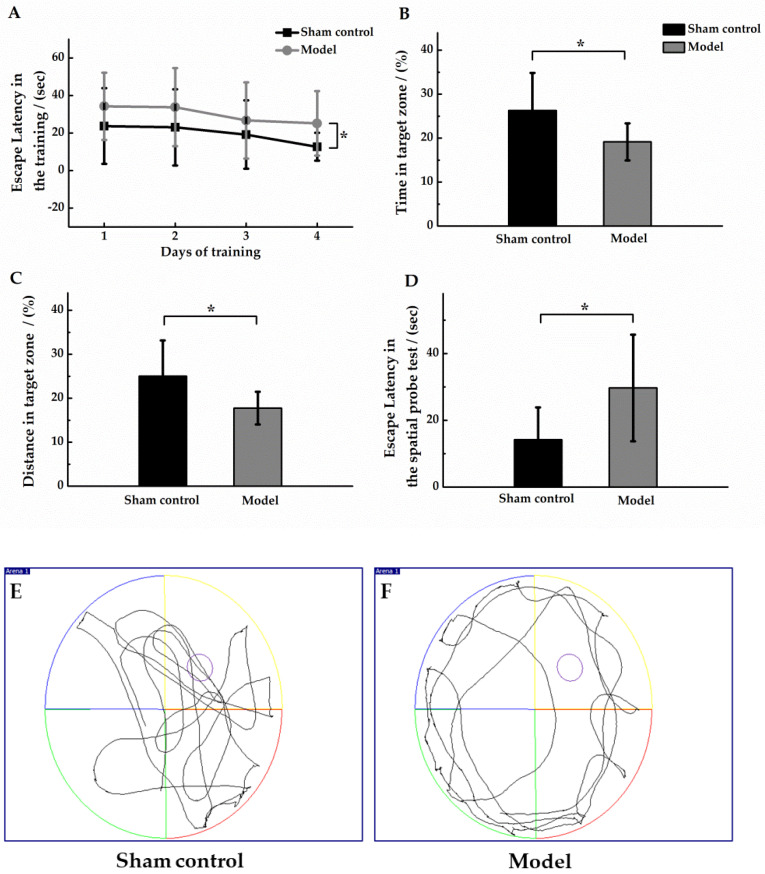
Figure 3.
Morris Water Maze test in sham control group (n = 10) and model group (n = 12). (A) Mean escape latency for both groups of animals. Training was performed three times per day for four days. In the spatial probe test, the ratio (%) of the residence time in the target area to the total time (B); the ratio (%) of the distance swam by the animal in the target area to the total distance swam (C); and the escape latency was defined as the time when the animal first crossed the location of the hidden platform (D). Compared with the sham control group, * p < 0.05. In the spatial probe test, the movement trajectories (60 s duration) of one mouse in the sham control group (E) and model group (F) were shown, and the platform was unavailable for escape.

